

We share verified earning schemes daily on Telegram.
In our Telegram channel, you'll find crypto signals, insider info on HYIPs, combo deals for tappers, and coin giveaways. Only verified earning methods without fluff.
The concept of support and resistance levels is one of the simplest to understand in technical analysis. Despite their apparent simplicity, these levels are very important for building your own trading strategy and analyzing price movements using various chart patterns, indicators, or cluster analysis.
How to Identify Support and Resistance Levels?
Parity is always understood as a temporary consensus that arises when:
- sellers decide that the current price is not attractive enough to sell and reduce their bearish pressure, while buyers perceive this price level as favorable for accumulating positions;
- buyers begin to take profits: the asset price at this moment is too high to buy, and selling starts to dominate.
It is precisely based on this that support and resistance levels are identified.
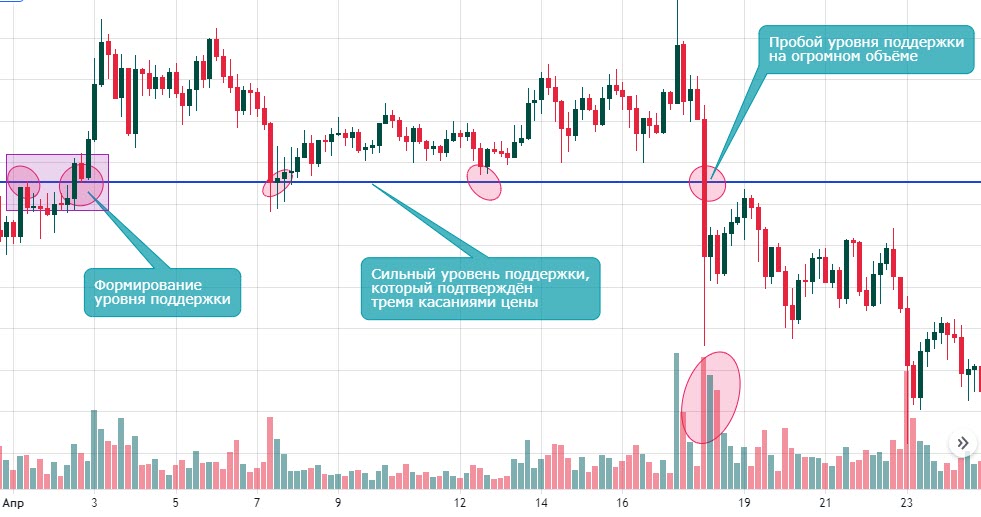
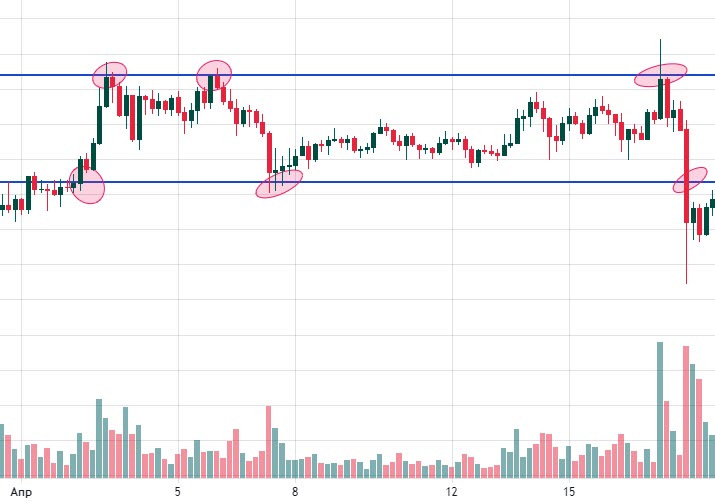
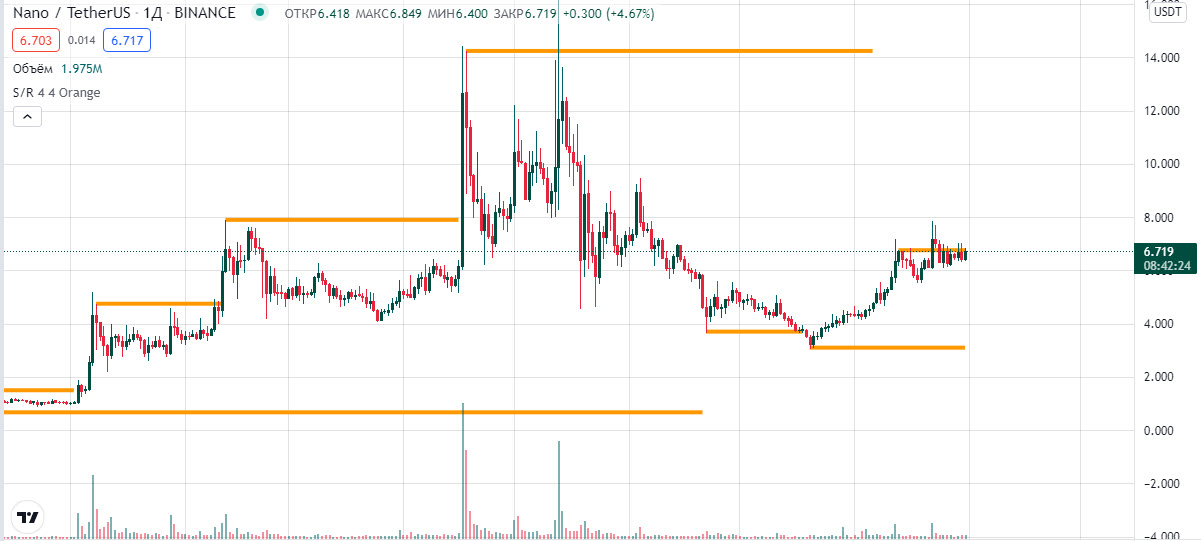
Support level (support line) appears when the price approaches a certain level from above down several times and bounces off it in the opposite direction.
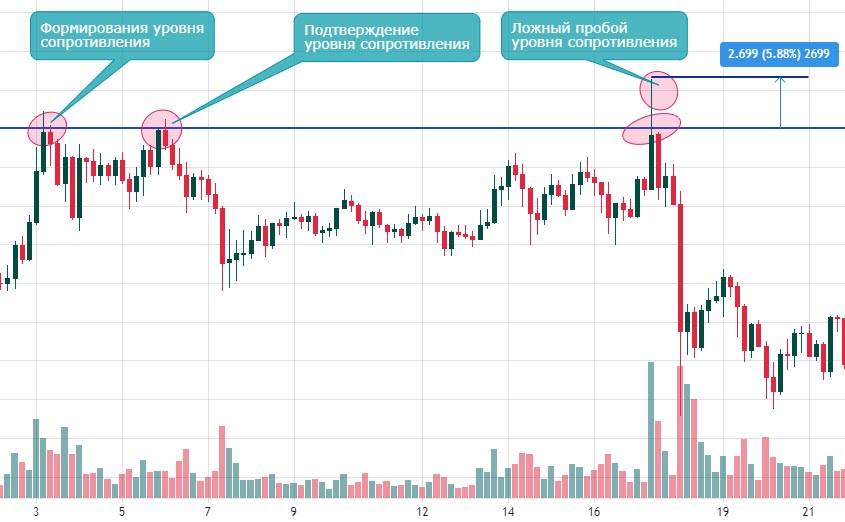
Resistance level (resistance line) occurs when the price approaches a certain level from below up followed by a rebound downwards.
Price Level Mechanics
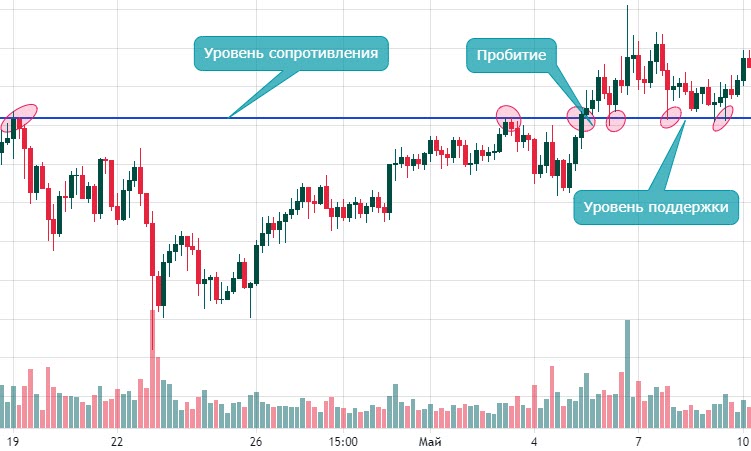
In the examples above, you can see the difference between a breakout and a false breakout of price levels.
When a resistance level is broken, it becomes a support level:
And vice versa: when a support level is broken, it becomes a resistance level.
Difference Between Price Levels and Trend Lines
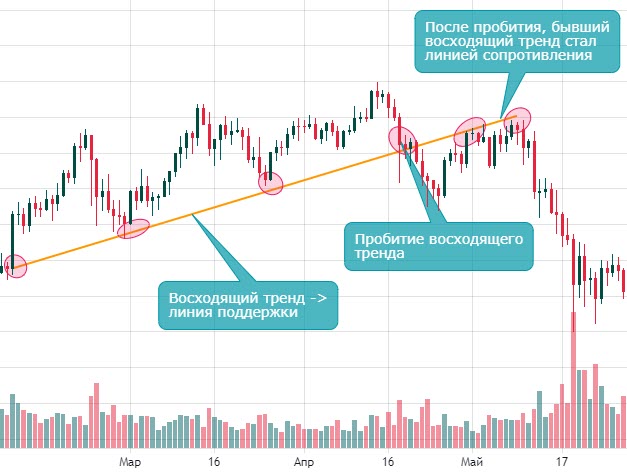
A trend line can be considered as a support or resistance line, possessing all the properties described above. The main difference between such a line and a price level is that a level is always horizontal, whereas trend lines are drawn based on price lows and highs.
Let's consider an uptrend that acts as support and then as resistance:
Support and Resistance Indicator
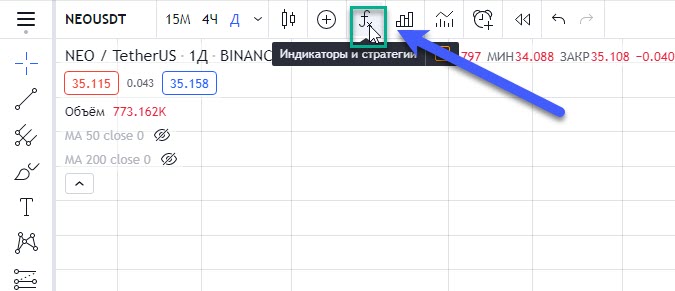
There are many indicators of this kind on TradingView. To find them, simply go to the indicators section:
Then enter the following keywords: support, resistance, indicator:
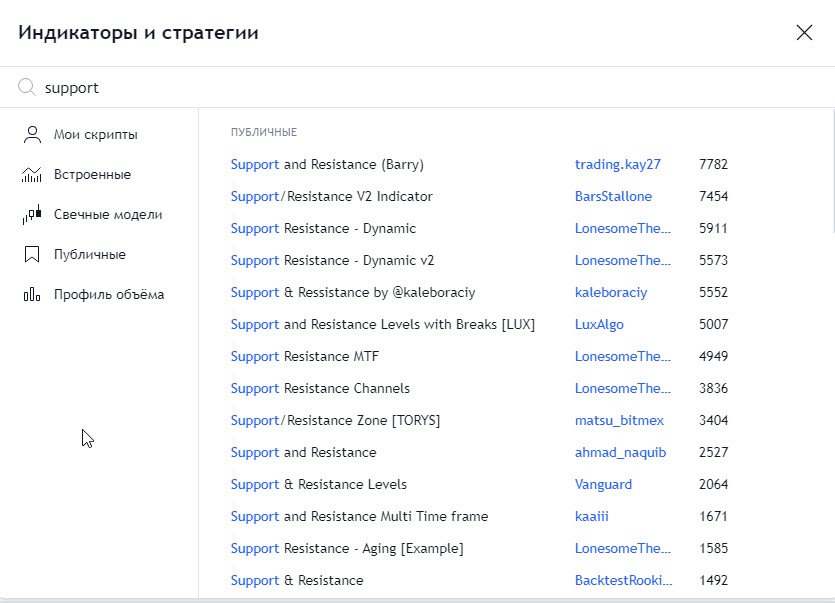
For example, I chose the second indicator from the list. Here is the result:
Conclusion
In conclusion, the following points can be made:
- Support and resistance levels characterize a temporary parity and consensus between sellers and buyers at certain price levels;
- It is better to start analyzing levels based on closing prices, i.e., on the bodies of Japanese candlesticks on higher chart timeframes;
- A support level, when broken, becomes a resistance level and vice versa;
- Levels form trading ranges and are always horizontal;
- Trend lines have the properties of support and resistance;
- There are many support and resistance indicators, but it is still better to identify these levels manually.
Advertising

Our Contacts
Investment portfolio
-
 mooner.pro Review100 Our deposit
 -
 aitimart.com Review300 Our deposit
Test projects
-
 agronomist-x.com Review300 Our deposit
 -
 taxi-money.info Review3150 Our deposit
Comments

✅ PAYING Aitimart Выплата получена на "Epaycore": Date: 15/09/2025 at 17:45 Transactions..
Выплата получена. Ваш депозит успешно подтвержден. Сумма депозита:3 USDT. Вид сети:BSC..
Новая выплата. Ваш депозит успешно подтвержден. Сумма депозита:5.9 USDT. Вид сети:BSC..
Быстрая выплата. Ваш депозит успешно подтвержден. Сумма депозита:4 USDT Вид сети:BSC..

Выплата. 17/09/2025 13:28 Top-up 1 USD Completed Payment system ePayCore E054677 Batch..

ID операции: 2853416 Дата операции: 17.09.2025 07:37 Сумма: 0.2 USD Примечание: Payment..
Advertising

Information
Users of Гости are not allowed to comment this publication.