


We share verified earning schemes daily on Telegram.
In our Telegram channel, you'll find crypto signals, insider info on HYIPs, combo deals for tappers, and coin giveaways. Only verified earning methods without fluff.
How to determine where the price will go during a correction or an upward move? To solve this task, we use Fibonacci levels – a graphical analysis tool based on the Fibonacci sequence. Thanks to its ease of use and quick learning curve, Fibonacci retracement is employed in many trading strategies and is used by the majority of traders.
"
Principles of Forming the Fibonacci Sequence
Fibonacci (Leonardo of Pisa) was the first major European mathematician who conducted practical research on the achievements of Indian mathematicians in Arabic numerals. Fibonacci's contribution lies in popularizing the positional number system, which is more convenient for counting than the Roman numeral system.
The Fibonacci sequence is a series of numbers: 0, 1, 1, 2, 3, 5, 8, 13, 21, 34, 55, and so on. The main rule for forming the sequence is that each next number is obtained by adding the two previous numbers.
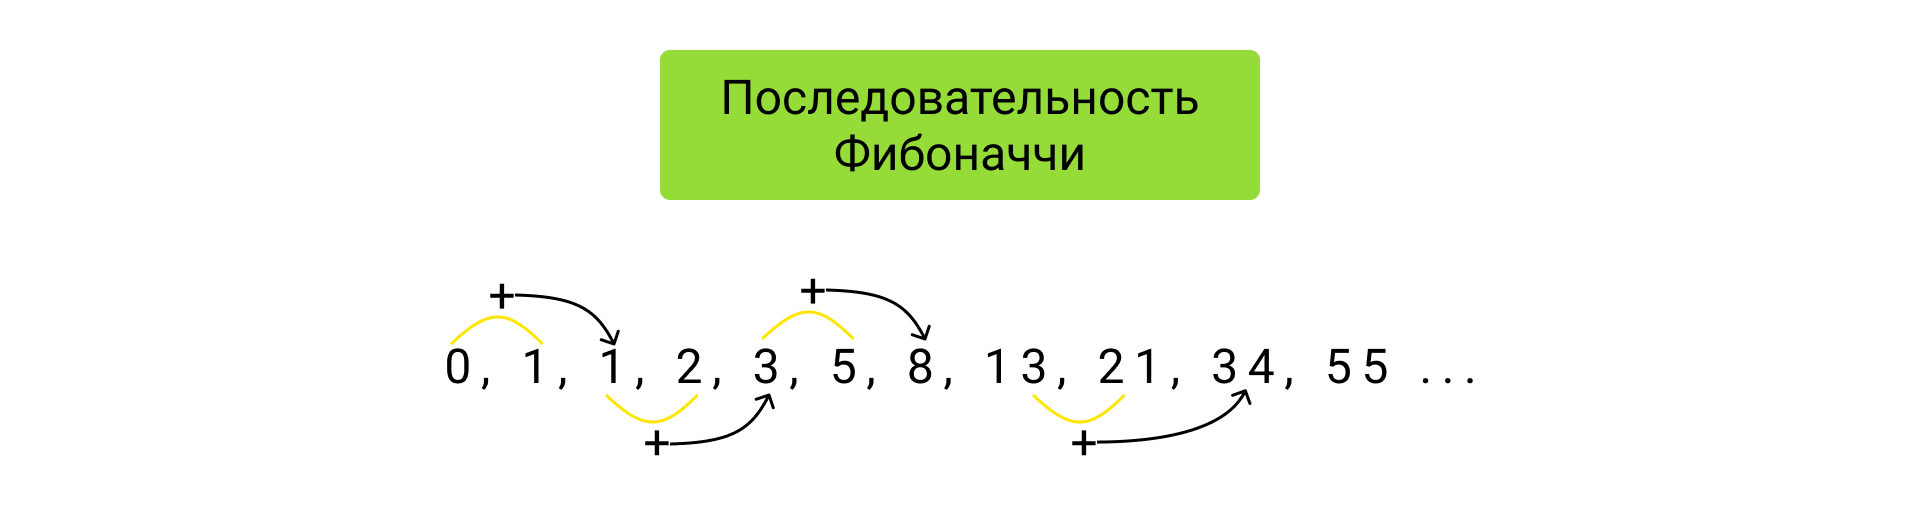
The Fibonacci sequence has very important physical, psychological, and even aesthetic significance. The fact is that people like only those objects that have correct proportions. But how can we understand how beautiful an object is using mathematics? It’s simple: the ratio of its sides should approach the golden ratio – 1.618!
The ratio of each number in the sequence to the previous one tends to the golden ratio 1.618. Moreover, the further the number is from the beginning of the sequence, the closer this ratio gets:
There are also several amazing mathematical properties of the Fibonacci sequence:
- each number in the sequence is 0.618 times the next number (34 = 55*0.618);
- each number is 0.382 times the number two places ahead (21 = 55*0.382);
- each number is 0.236 times the number three places ahead (13 = 55*0.236).
It is based on these properties that Fibonacci levels are constructed.
Principles of Building Fibonacci Corrections
There are two types of market situations where the Fibonacci correction tool is applicable:
- In the case of a growth correction: an uptrend is observed, and you need to determine the levels to which the price may correct for position accumulation, as well as the levels at which you will take profit on your long positions;
- In the case of a decline correction: the market is in a downtrend, and you determine the levels of possible price "bounce" to accumulate a short position, as well as the area for closing positions.
Therefore, keep in mind the following scheme:
- Draw growth corrections from the low (i.e., the starting point of the trend, equal to the minimum price) to the high (i.e., the maximum price where the correction began);
- Draw decline corrections the opposite way, from the high (starting point of the downtrend when the decline just began) to the low (minimum price where the bounce started).
Let's consider a growth correction:
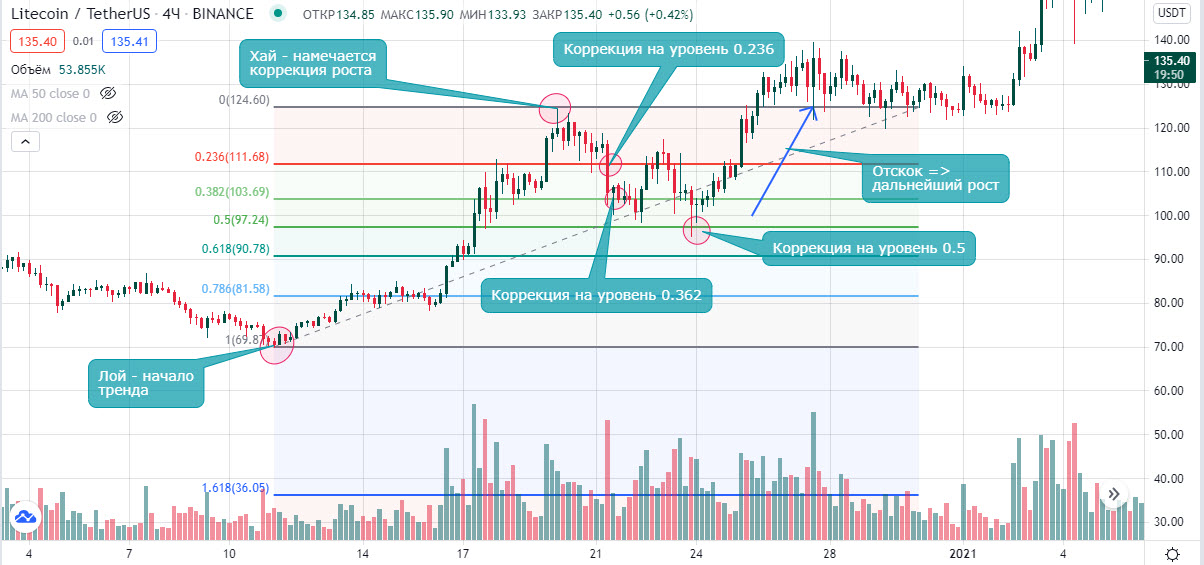
As we see, there is a strong bullish trend (determined by the MA) with large trading volumes. Buying dominates, and we want to accumulate a long position. The level 1 of Fibonacci is placed at the minimum point, and 0 at the potential high. If the maximum keeps updating, move this level until the correction starts.
...The final movement yields 86% profit from the entry point:
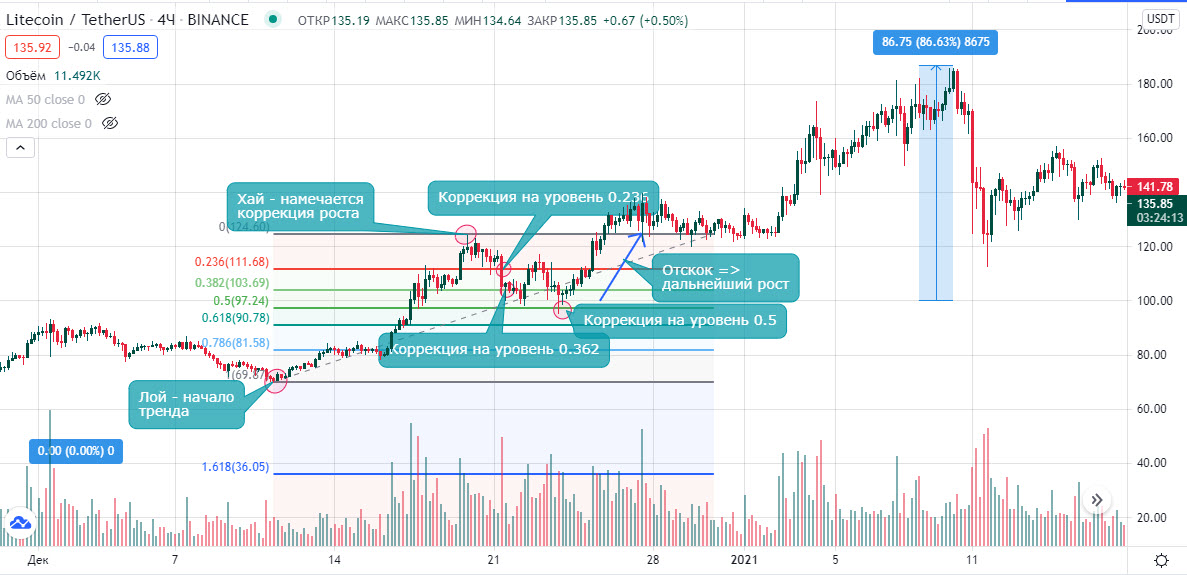
However, it is clear that capturing the entire movement is impossible. Therefore, it is easier to trade several "fib" levels considering the condition that the correction ends (price reaches levels 0.5 – 0.618):
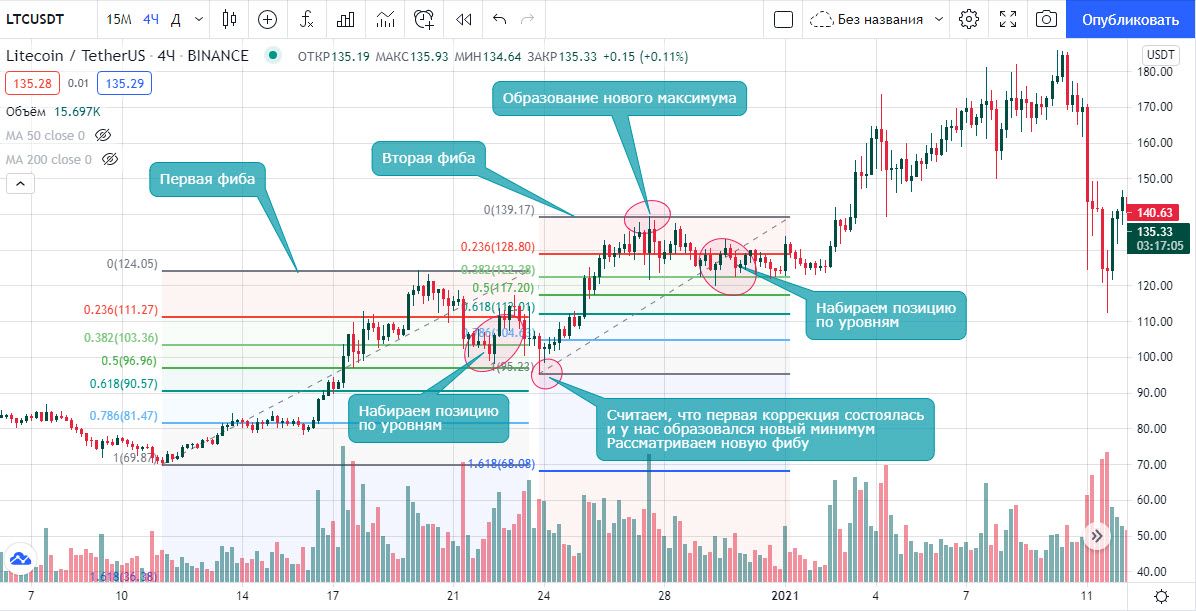
You can also trade local fibs within one large fib. In this case, you determine the main fib for the entire movement on a large timeframe – 4 hours / 1 day, as well as local fibs on 15M and 1-hour timeframes.
For decline corrections, act similarly, but draw the fib from the high to the low:
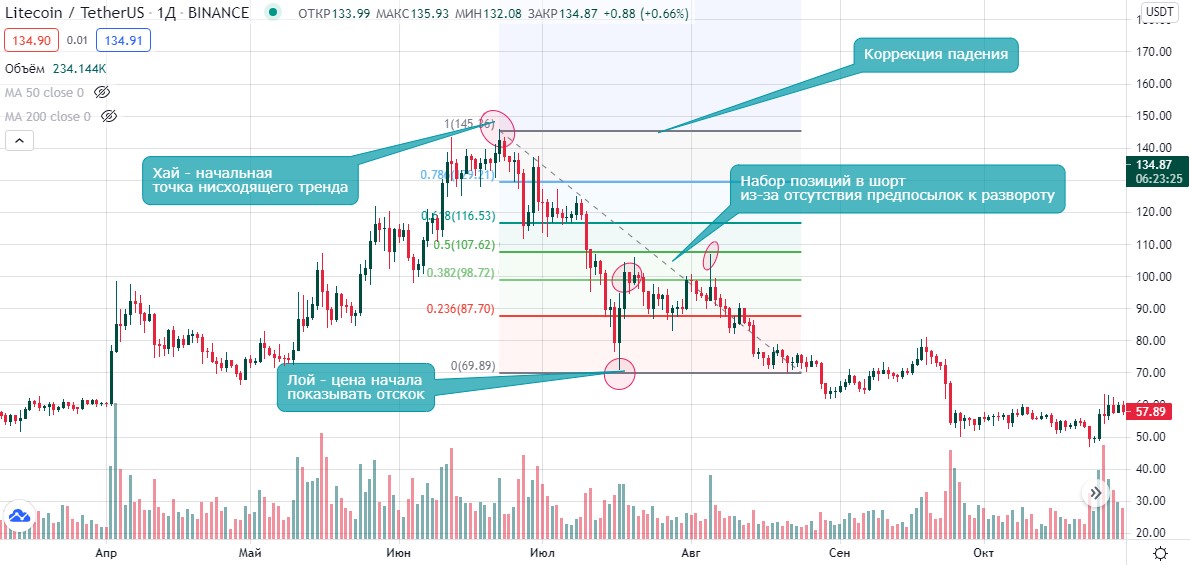
Accumulating a short position happens when a fundamental market factor supports selling, i.e., bullish sentiment changes to bearish. You can assess this based on fundamental news, Bitcoin behavior, volume analysis, and overall trends using moving averages. If the price is below the MA and selling dominates, trade only from the short side.
When short trading based on decline correction, positions are also accumulated at fib levels, and targets are set beyond level 0, i.e., beyond the previous low, hoping for its update. In this case, I also recommend trading several fibs at once: one global and local ones on small timeframes. This way, your cumulative profit will be higher.
How to Set Up Fibonacci Correction in TradingView?
Fibonacci correction in TradingView is represented by the Fib Retracement tool, located in the "Gann and Fibonacci Tools" section:
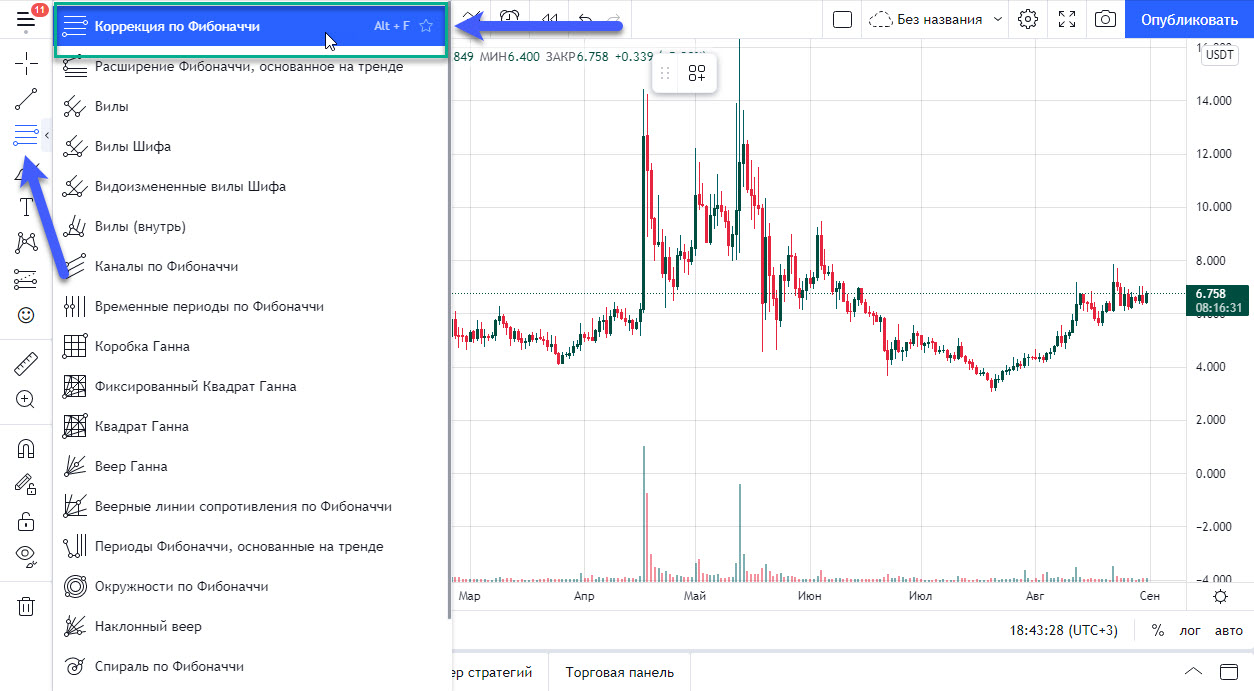
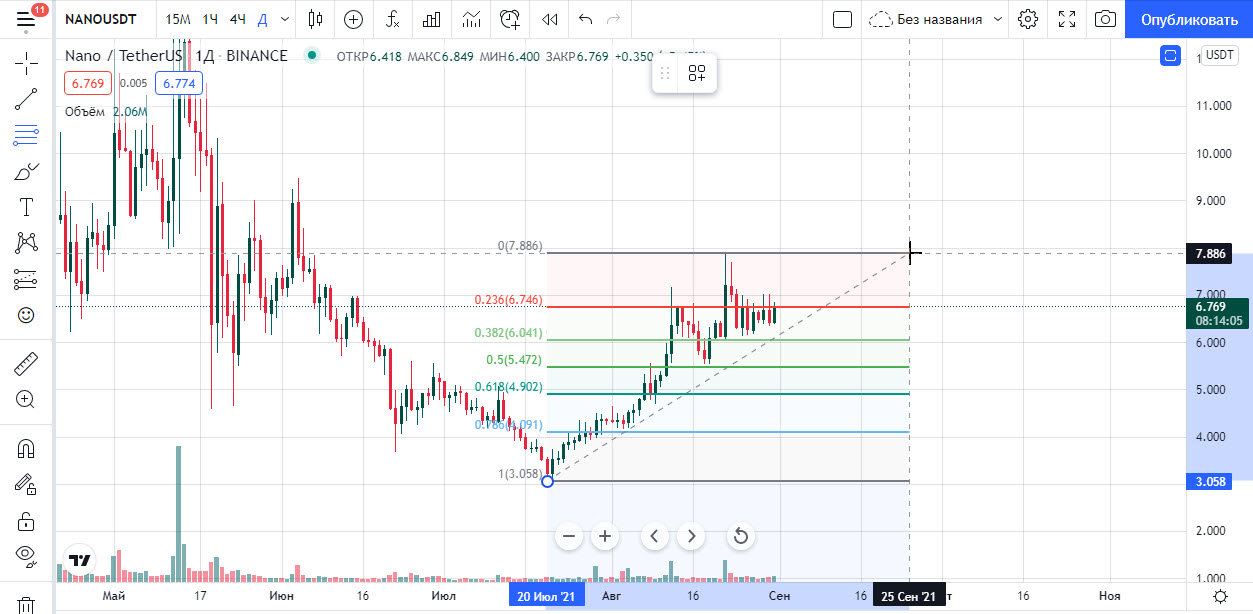
After enabling Fibonacci correction, just select the start and end points:
Conclusion
Some final notes:
- Fibonacci levels are used to determine correction levels for growth and decline.
- Thanks to the Fib Retracement tool, you can identify price ranges for accumulating positions and for taking profits.
- The Fibonacci grid is always drawn along the trend. It is impossible to place the grid "in the air," saying "I'm fine anyway";)
- The start and end points of the grid must fall on the candle shadows.
- It is very good when Fibonacci levels coincide with support and resistance levels.
- Fibonacci correction can only be applied in clearly defined trend conditions. In narrow flat movements, Fib Retracement is useless.
Advertising

Our Contacts
Investment portfolio
-
 mooner.pro Review100 Our deposit
 -
 aitimart.com Review300 Our deposit
Test projects
-
 agronomist-x.com Review300 Our deposit
 -
 taxi-money.info Review3150 Our deposit
Comments

✅ PAYING Aitimart Выплата получена на "Epaycore": Date: 15/09/2025 at 17:45 Transactions..
Выплата получена. Ваш депозит успешно подтвержден. Сумма депозита:3 USDT. Вид сети:BSC..
Новая выплата. Ваш депозит успешно подтвержден. Сумма депозита:5.9 USDT. Вид сети:BSC..
Быстрая выплата. Ваш депозит успешно подтвержден. Сумма депозита:4 USDT Вид сети:BSC..

Выплата. 17/09/2025 13:28 Top-up 1 USD Completed Payment system ePayCore E054677 Batch..

ID операции: 2853416 Дата операции: 17.09.2025 07:37 Сумма: 0.2 USD Примечание: Payment..
Advertising

Information
Users of Гости are not allowed to comment this publication.