


We share verified earning schemes daily on Telegram.
In our Telegram channel, you'll find crypto signals, insider info on HYIPs, combo deals for tappers, and coin giveaways. Only verified earning methods without fluff.
The price chart with Japanese candlesticks is the first thing anyone interested in buying an asset on the exchange encounters. Japanese candlesticks provide a clear understanding of price fluctuations within a specified timeframe, which is why they are so popular.
Japanese candlesticks allow for a more accurate assessment of the prevailing market sentiment over a certain period, as well as forecasting future price changes based on the interpretation of their combinations – candlestick patterns.
Candles communicate the current trend, its strength, and momentum in a clear graphical language. A simple example: many "green" large ("tall") candles clearly indicate a strong bullish trend. Conversely, "small" candles at the end of a trend signal its fading.
This lesson will cover how to correctly interpret Japanese candlesticks and their patterns.
How to Read Japanese Candlesticks and Their Formation Principles
Any Japanese candlestick consists of a body and shadows, which inform the trader about:
- the opening price;
- the closing price;
- the minimum price;
- the maximum price
within the current chart timeframe.
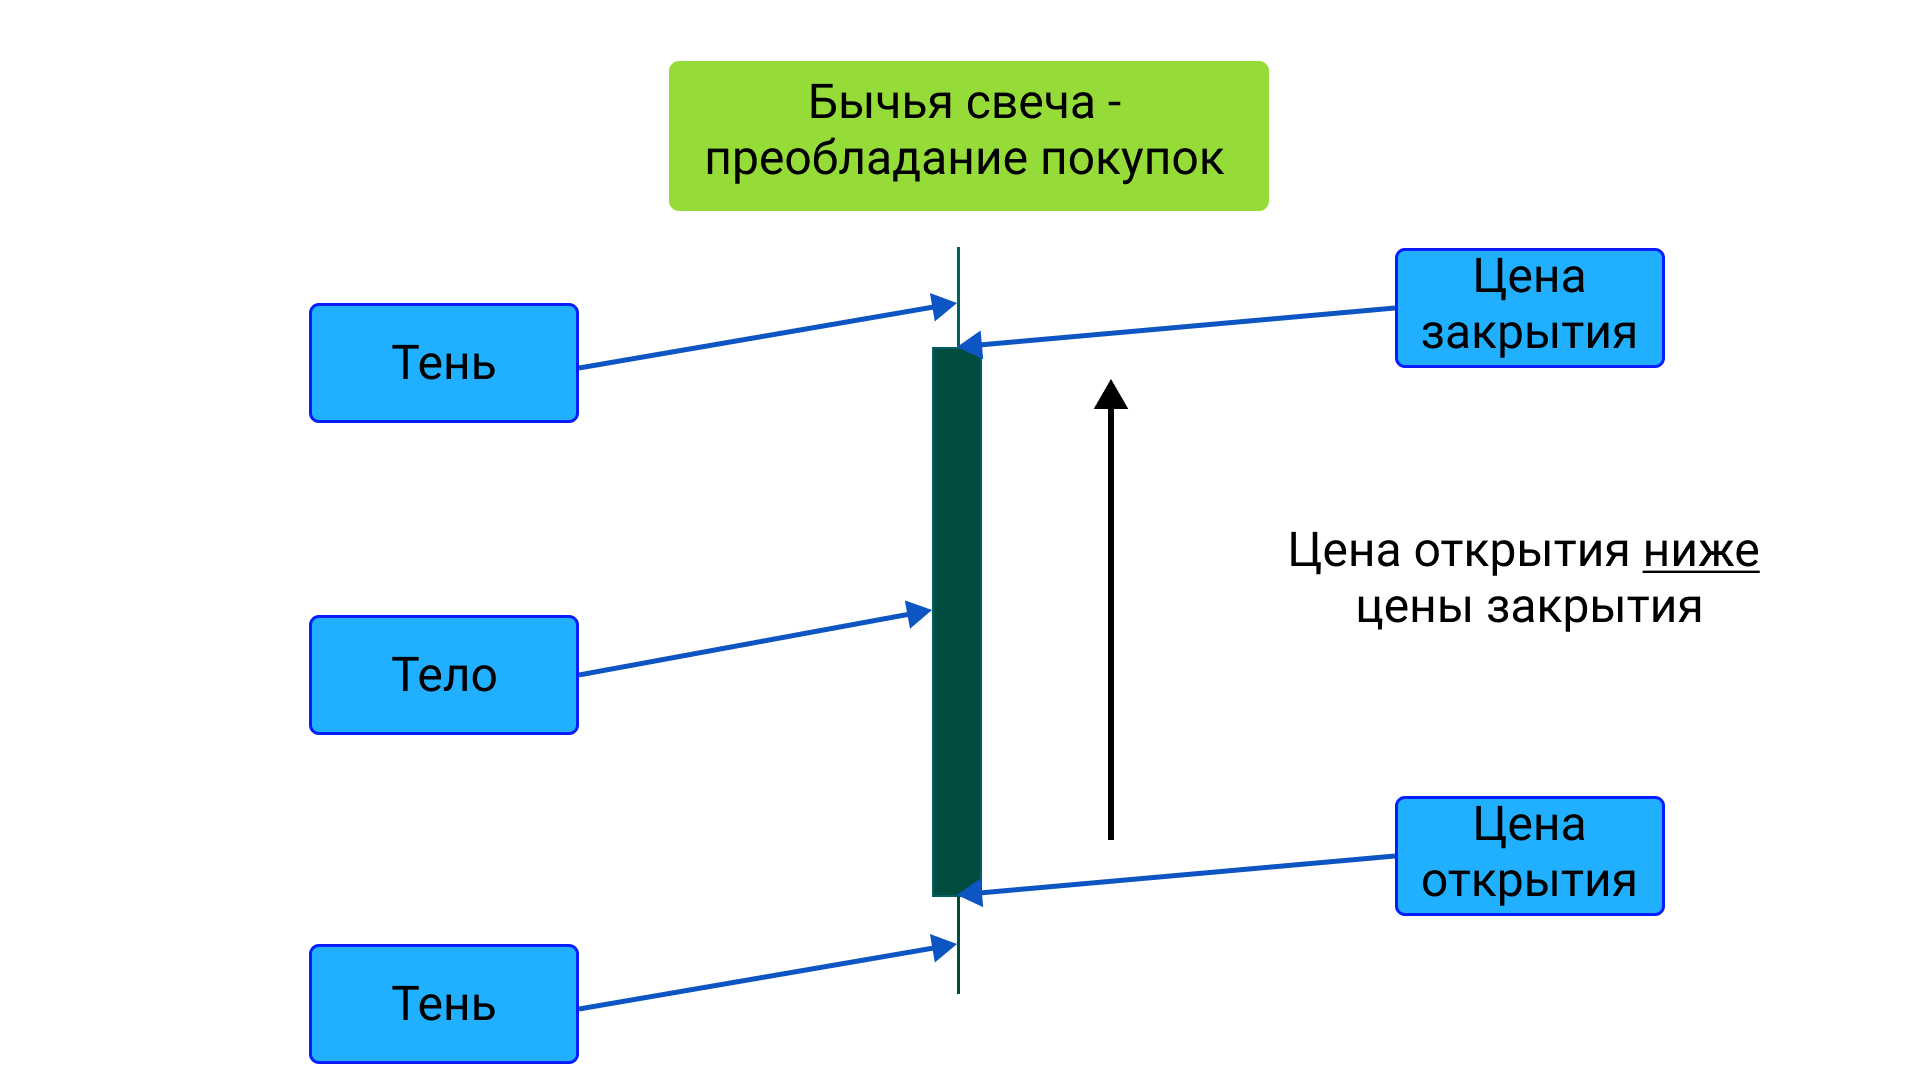
Let's consider the formation of a bullish candle:
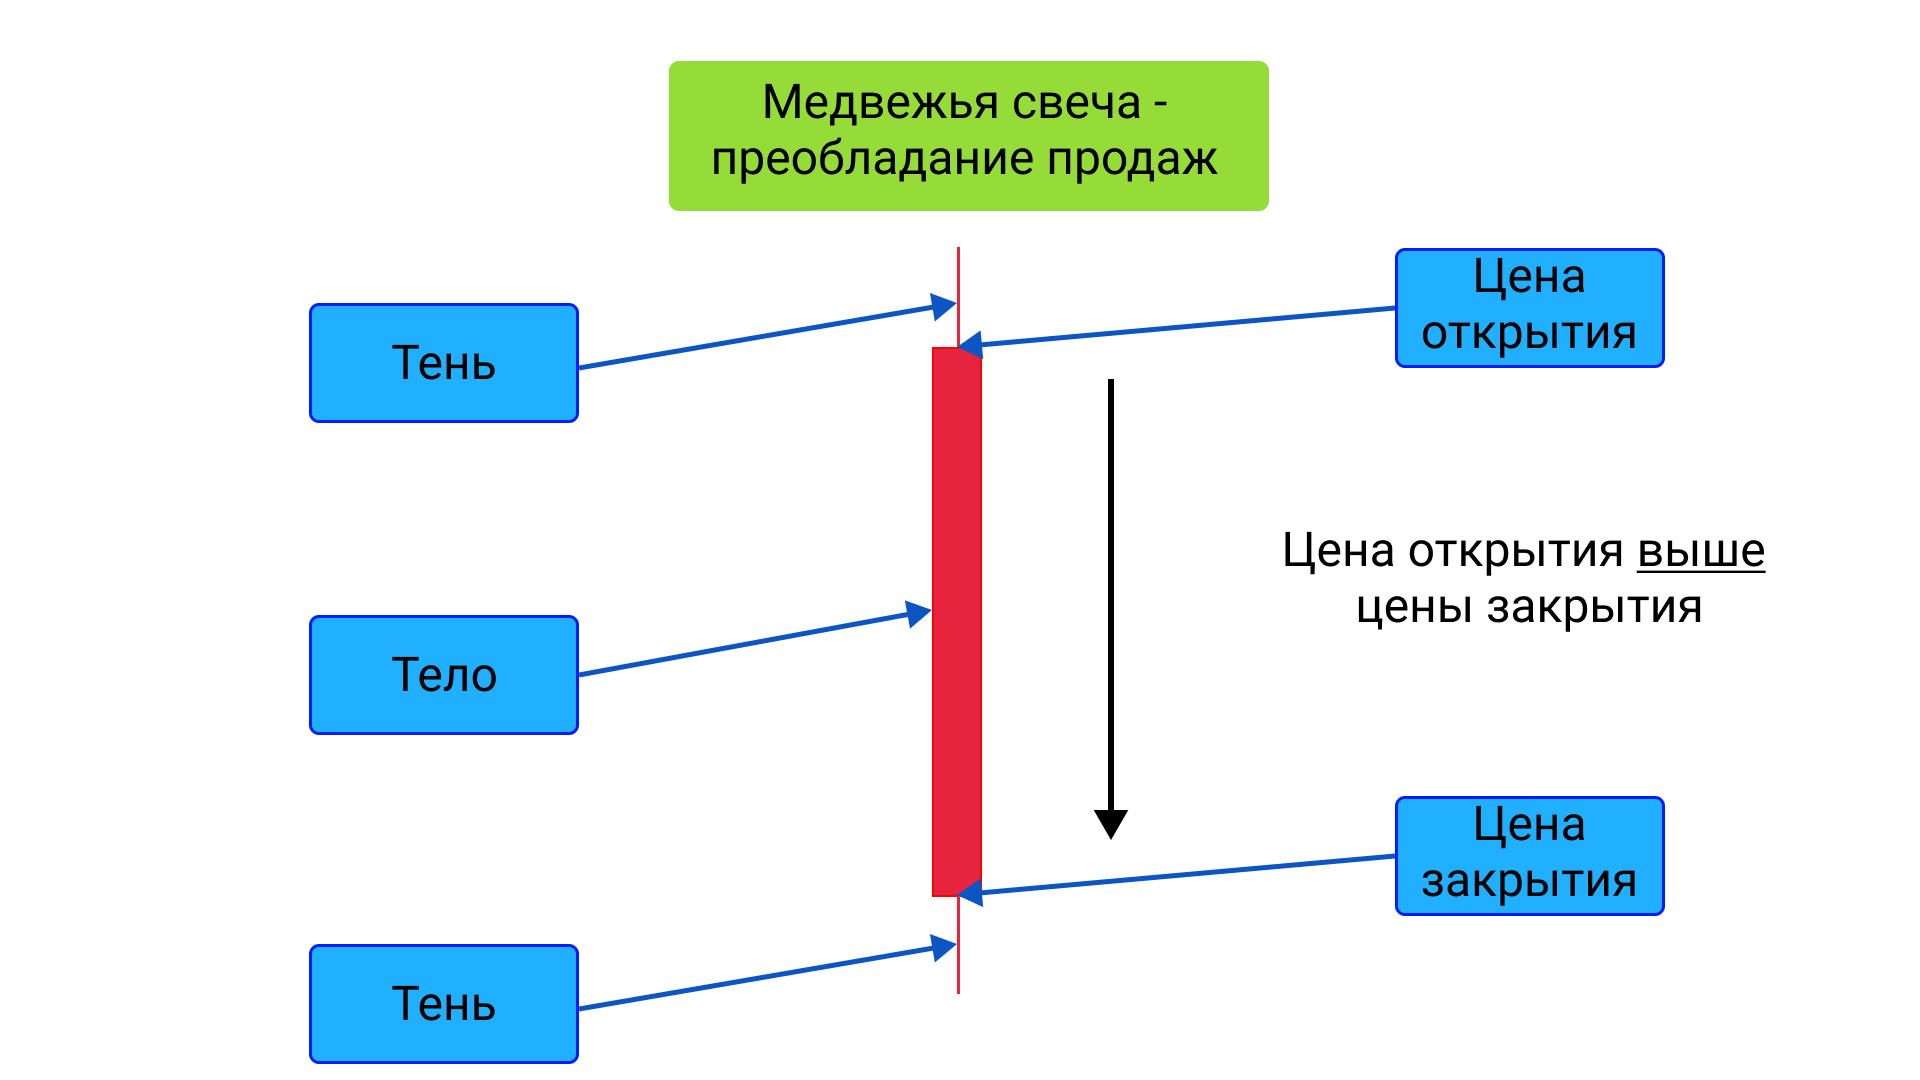
The situation is similar with a bearish candle:
To summarize:
- the candle body is bounded by the opening and closing prices;
- the opening price is the value at the start of the candle formation;
- the closing price is the value at the end of the candle formation;
- the minimum price corresponds to the starting point of the lower shadow;
- the maximum price corresponds to the endpoint of the upper shadow.
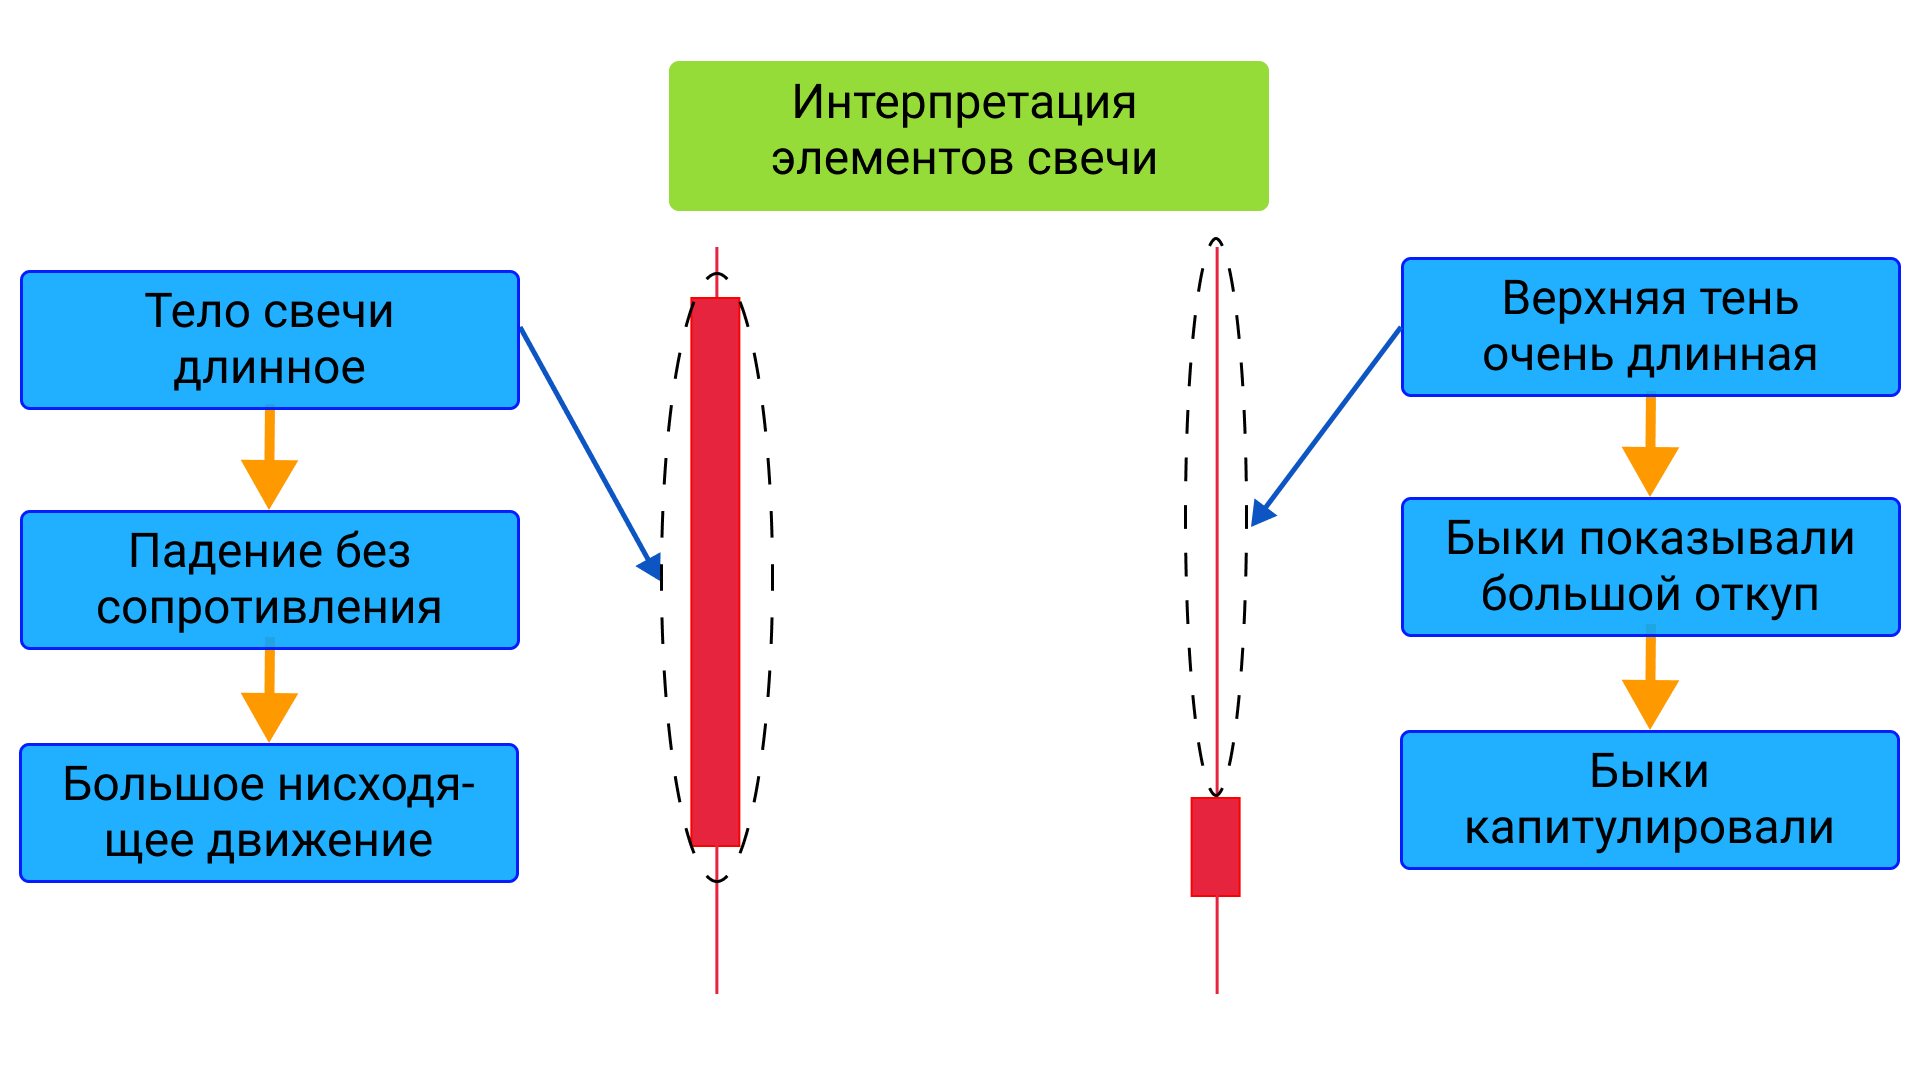
Based on this, we can interpret the components of Japanese candlesticks as follows:
- a large candle body with small shadows indicates a strong one-directional trend that faced no significant resistance;
- long shadows indicate a fierce and intense battle between market participants during the candle formation.
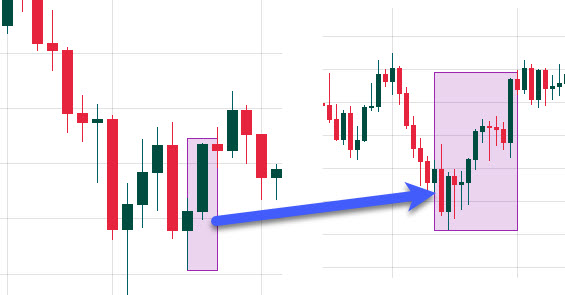
See how a 1-day candle unfolds on a 4-hour chart:
What is Candlestick Analysis?
From the previous section, you clearly understood:
As a result, several characteristic Japanese candlesticks can form the following types of patterns:
- reversal – the current trend changes to the opposite;
- continuation – indicates the trend will continue.
Candlestick analysis is an algorithm for determining the current market trend, as well as possible reversal or continuation patterns based on Japanese candlesticks and their combinations.
The magic of candlestick analysis lies in the fact that Japanese candlesticks can be viewed as a powerful technical indicator, which is important to analyze when:
- approaching key support and resistance levels;
- price touches a trendline;
- price breaks out or compresses within a chart pattern;
Types of Japanese Candlesticks and Candlestick Patterns
Marubozu
The simplest and easiest-to-remember candle. In the classic form, it consists only of a large body without any shadows:
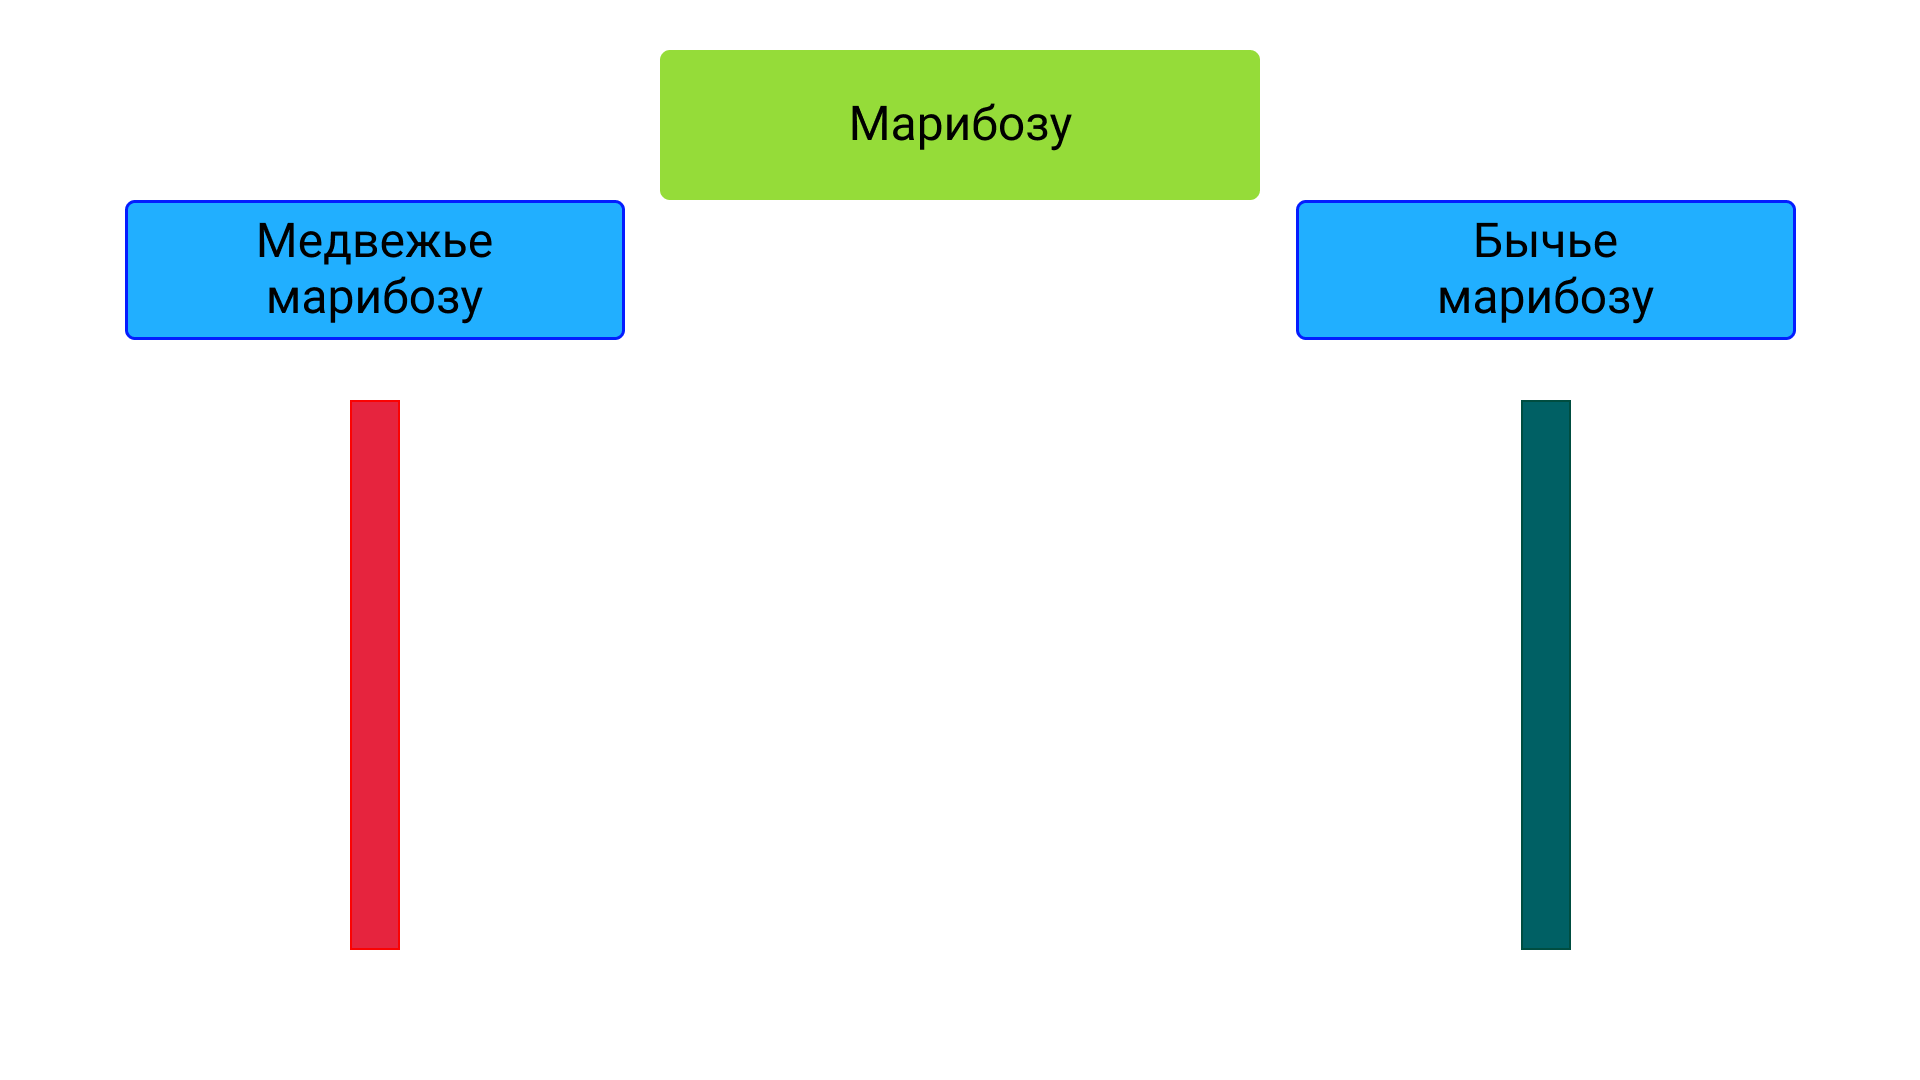
Indicates no resistance during price formation. Bearish Marubozu: no buyers in the market and the price "flies" down without stopping. Bullish Marubozu: buyers face no opposition from bears and easily push the price in their desired direction.
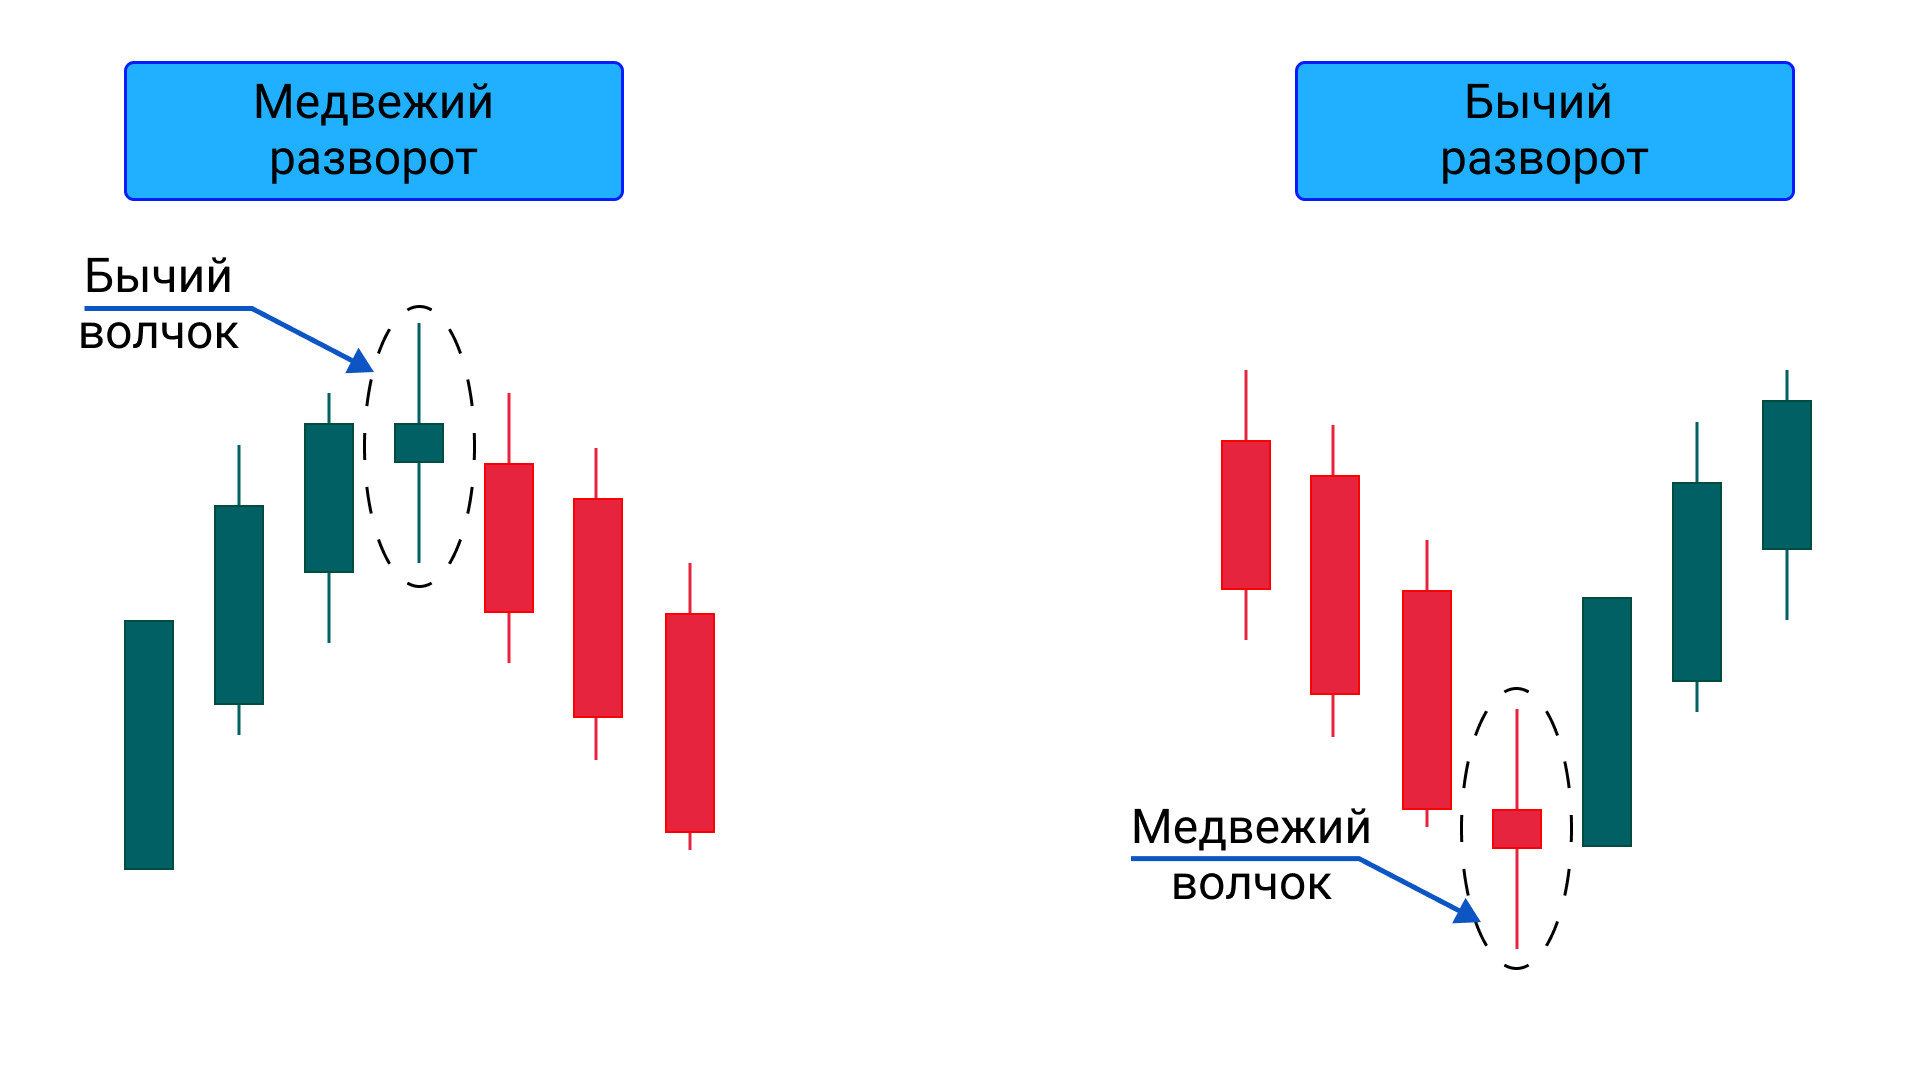
Spinning Top
A spinning top is a candle with a very small body shaped like a flat rectangle and long shadows that far exceed the body height. This candle indicates a fierce struggle between sellers and buyers. Neither side has a decisive victory, resulting in the closing price being close to the opening price.
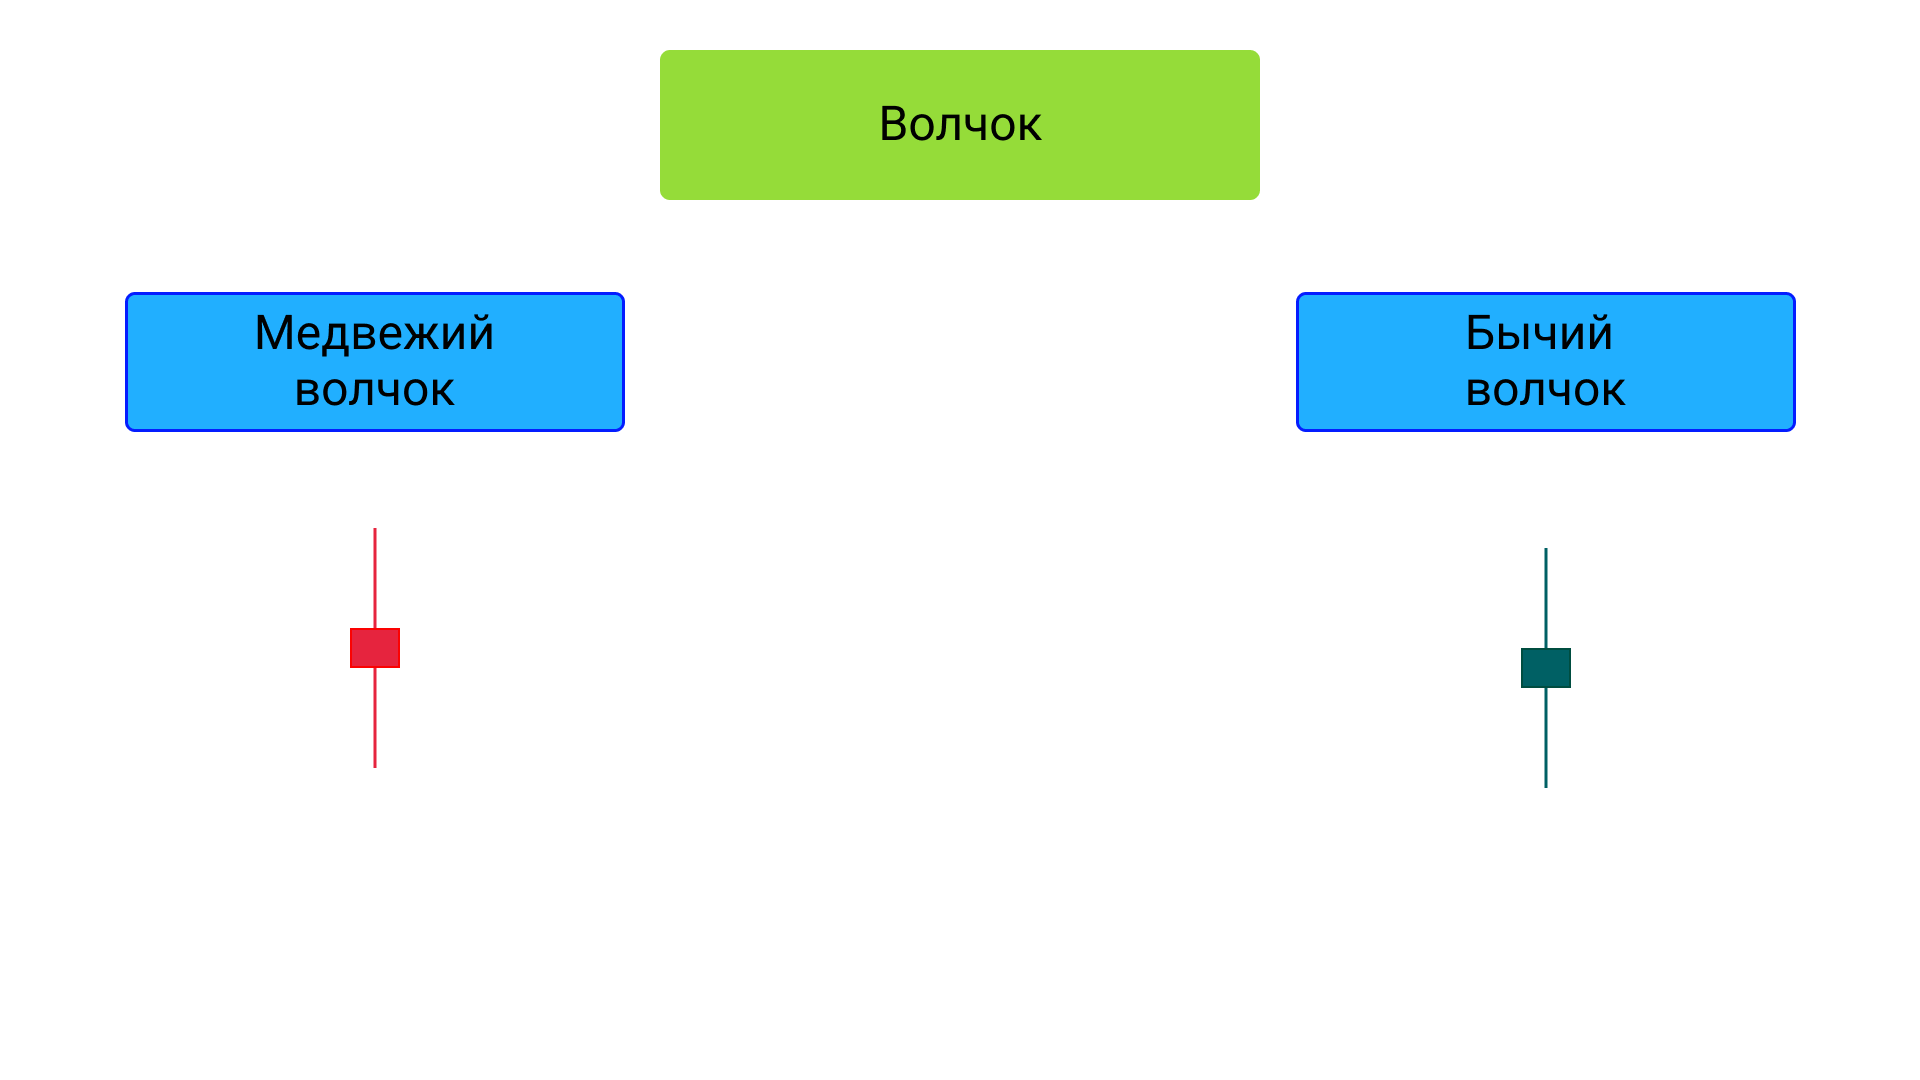
The spinning top is a reversal pattern and forms either a bearish or bullish reversal:
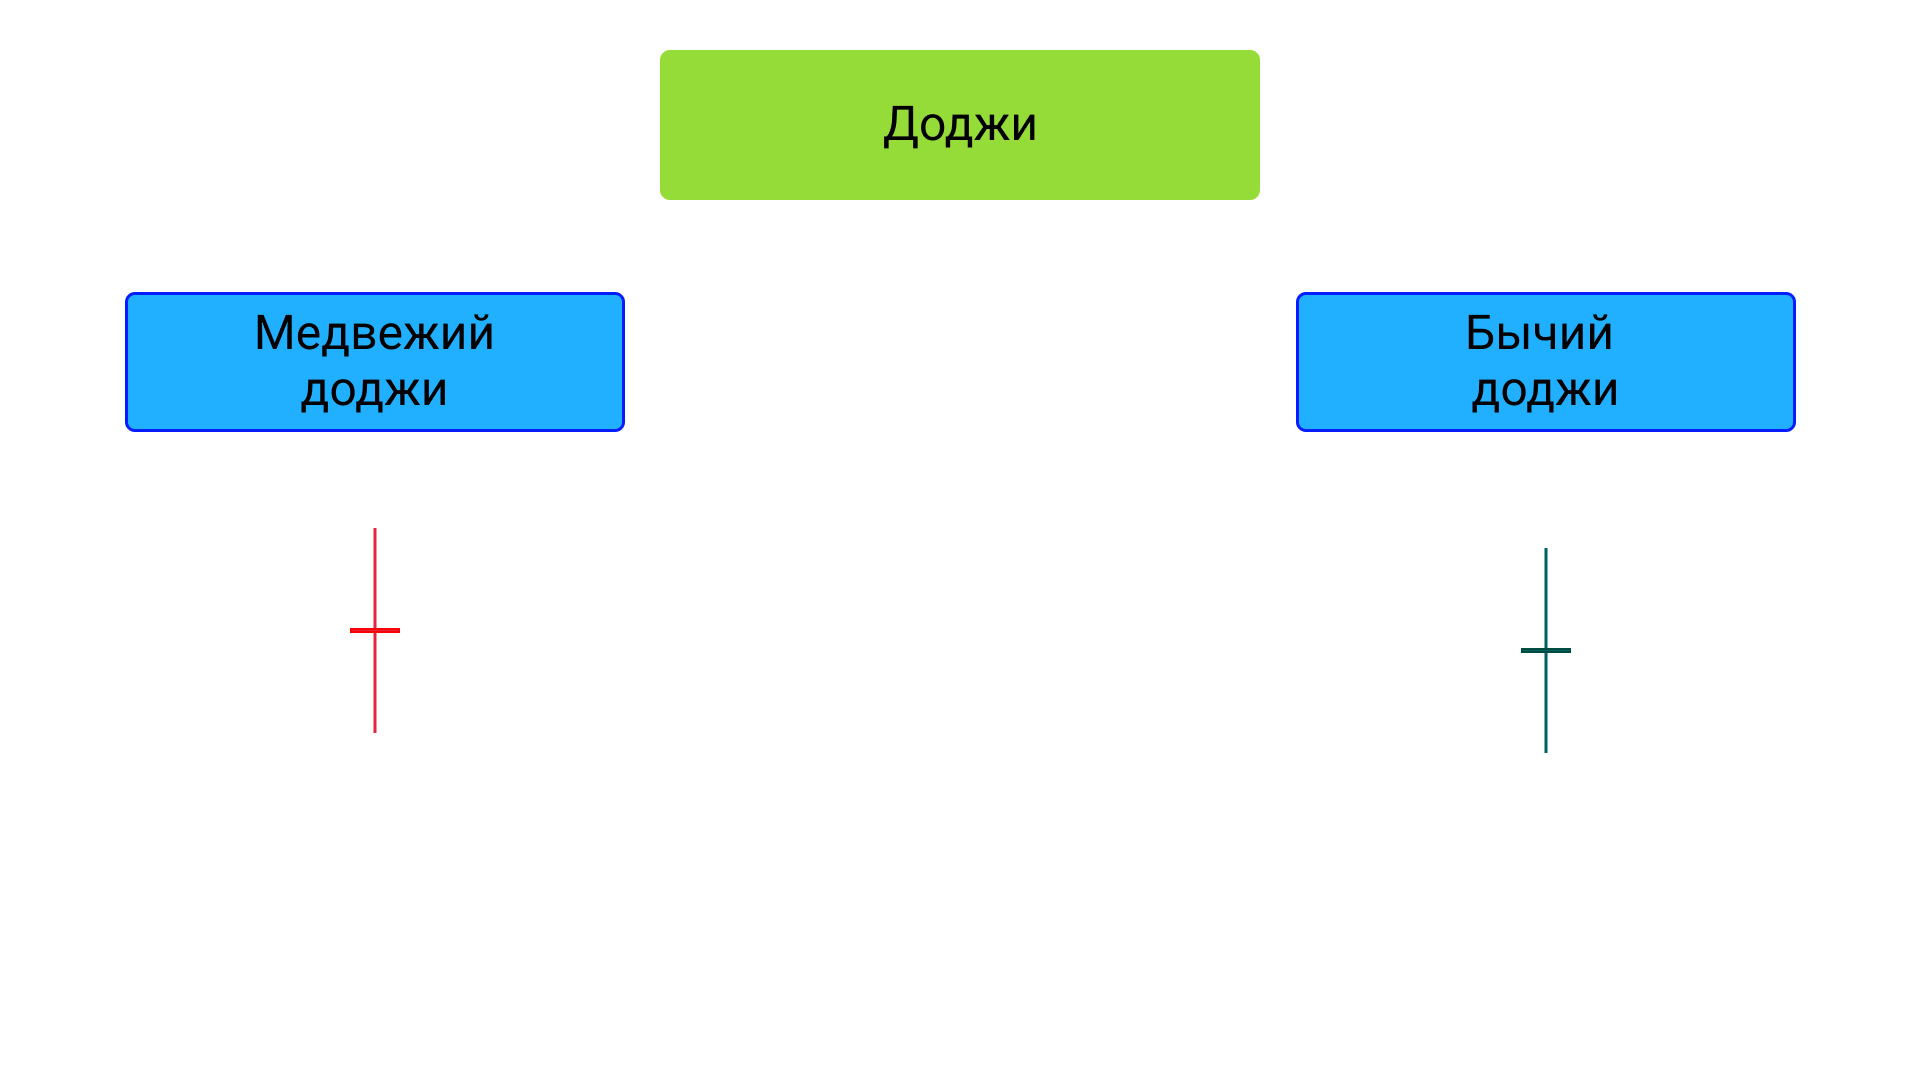
Doji
This candle almost has no body because the opening price equals the closing price, making it very similar to a spinning top.
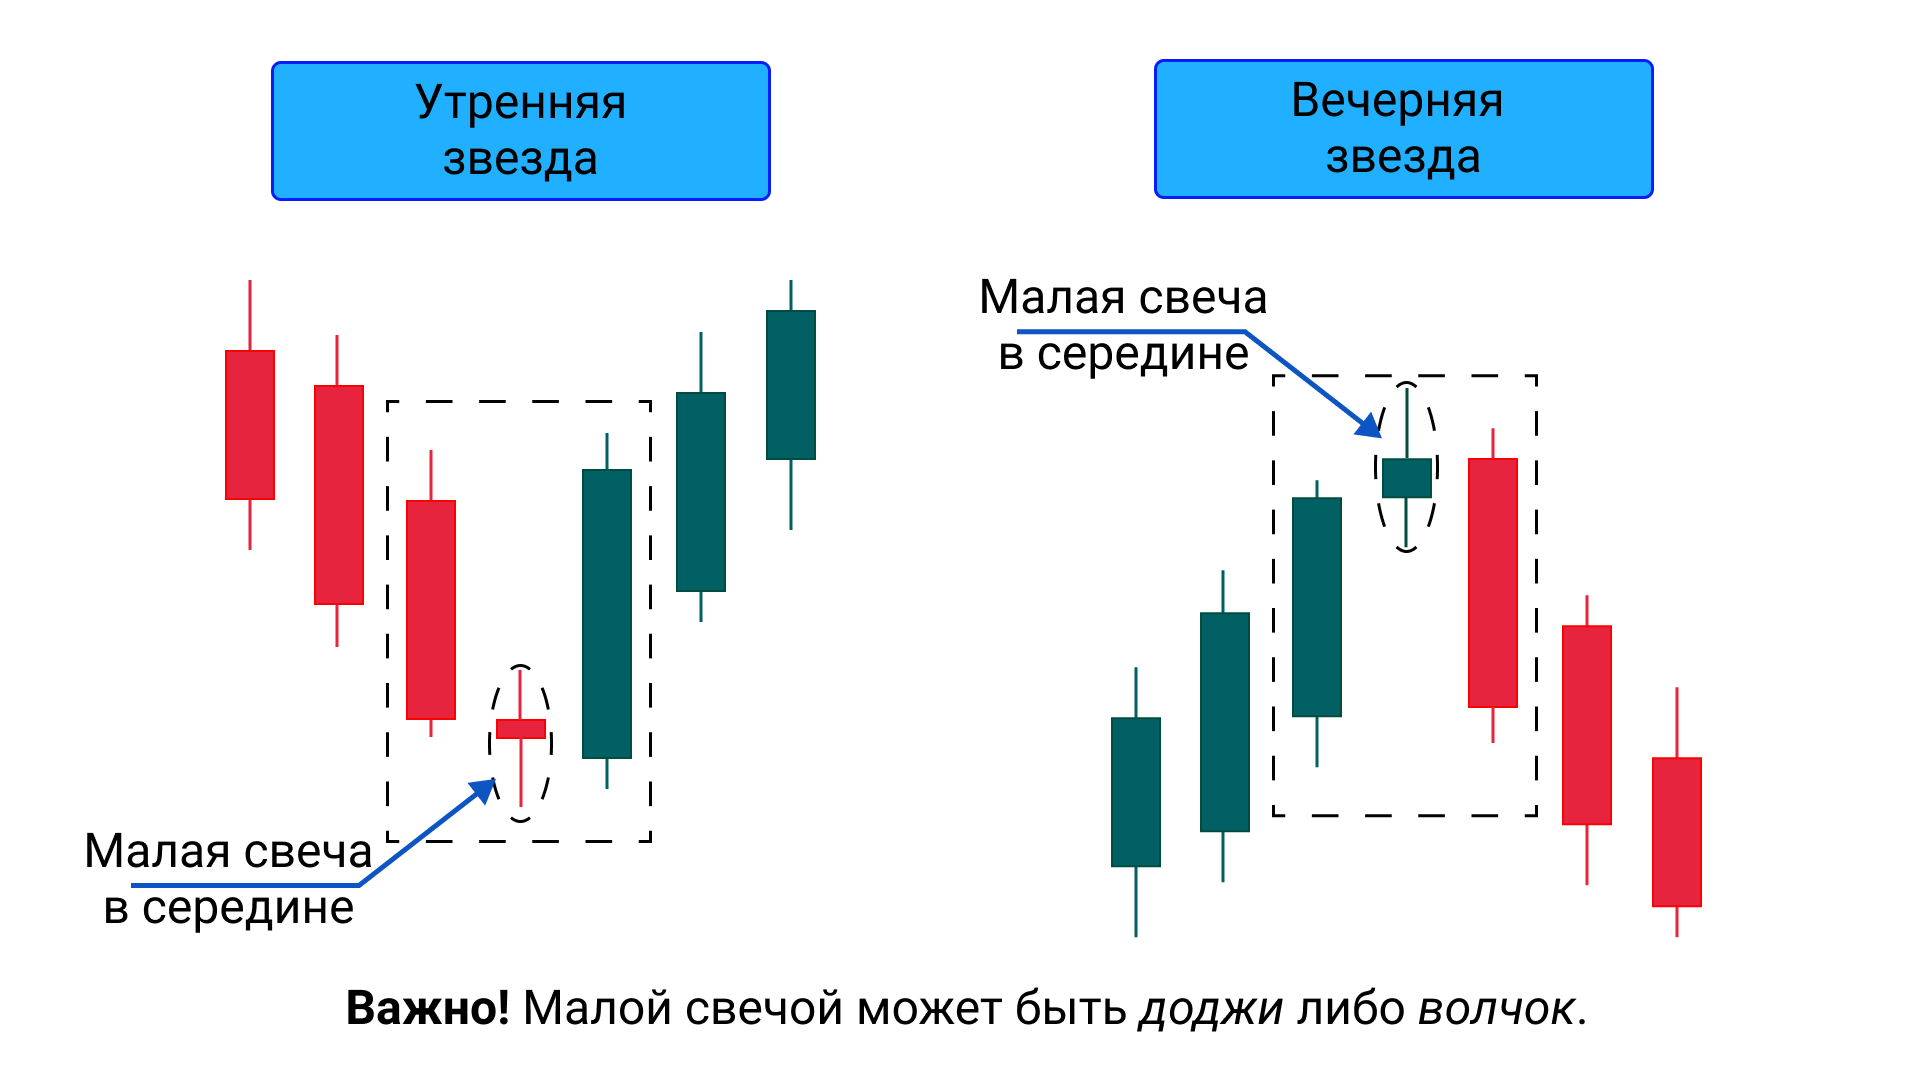
Star
Star is a reversal candlestick pattern consisting of three candles: two long ones on the edges and a small one in the middle. The small candle indicates weakness of the previous trend and equality of forces between sellers and buyers, followed by a shift in the situation.
Depending on its position on the chart, there are morning and evening stars.
The morning star is located at the bottom ("at the bottom") of a descending chart and represents the following combination:
[long red candle] => [very small candle] => [large green candle].
The evening star is located at the top of an uptrend and represents:
[long green candle] => [very small candle] => [large red candle].
For simplicity, I always use the following analogy:
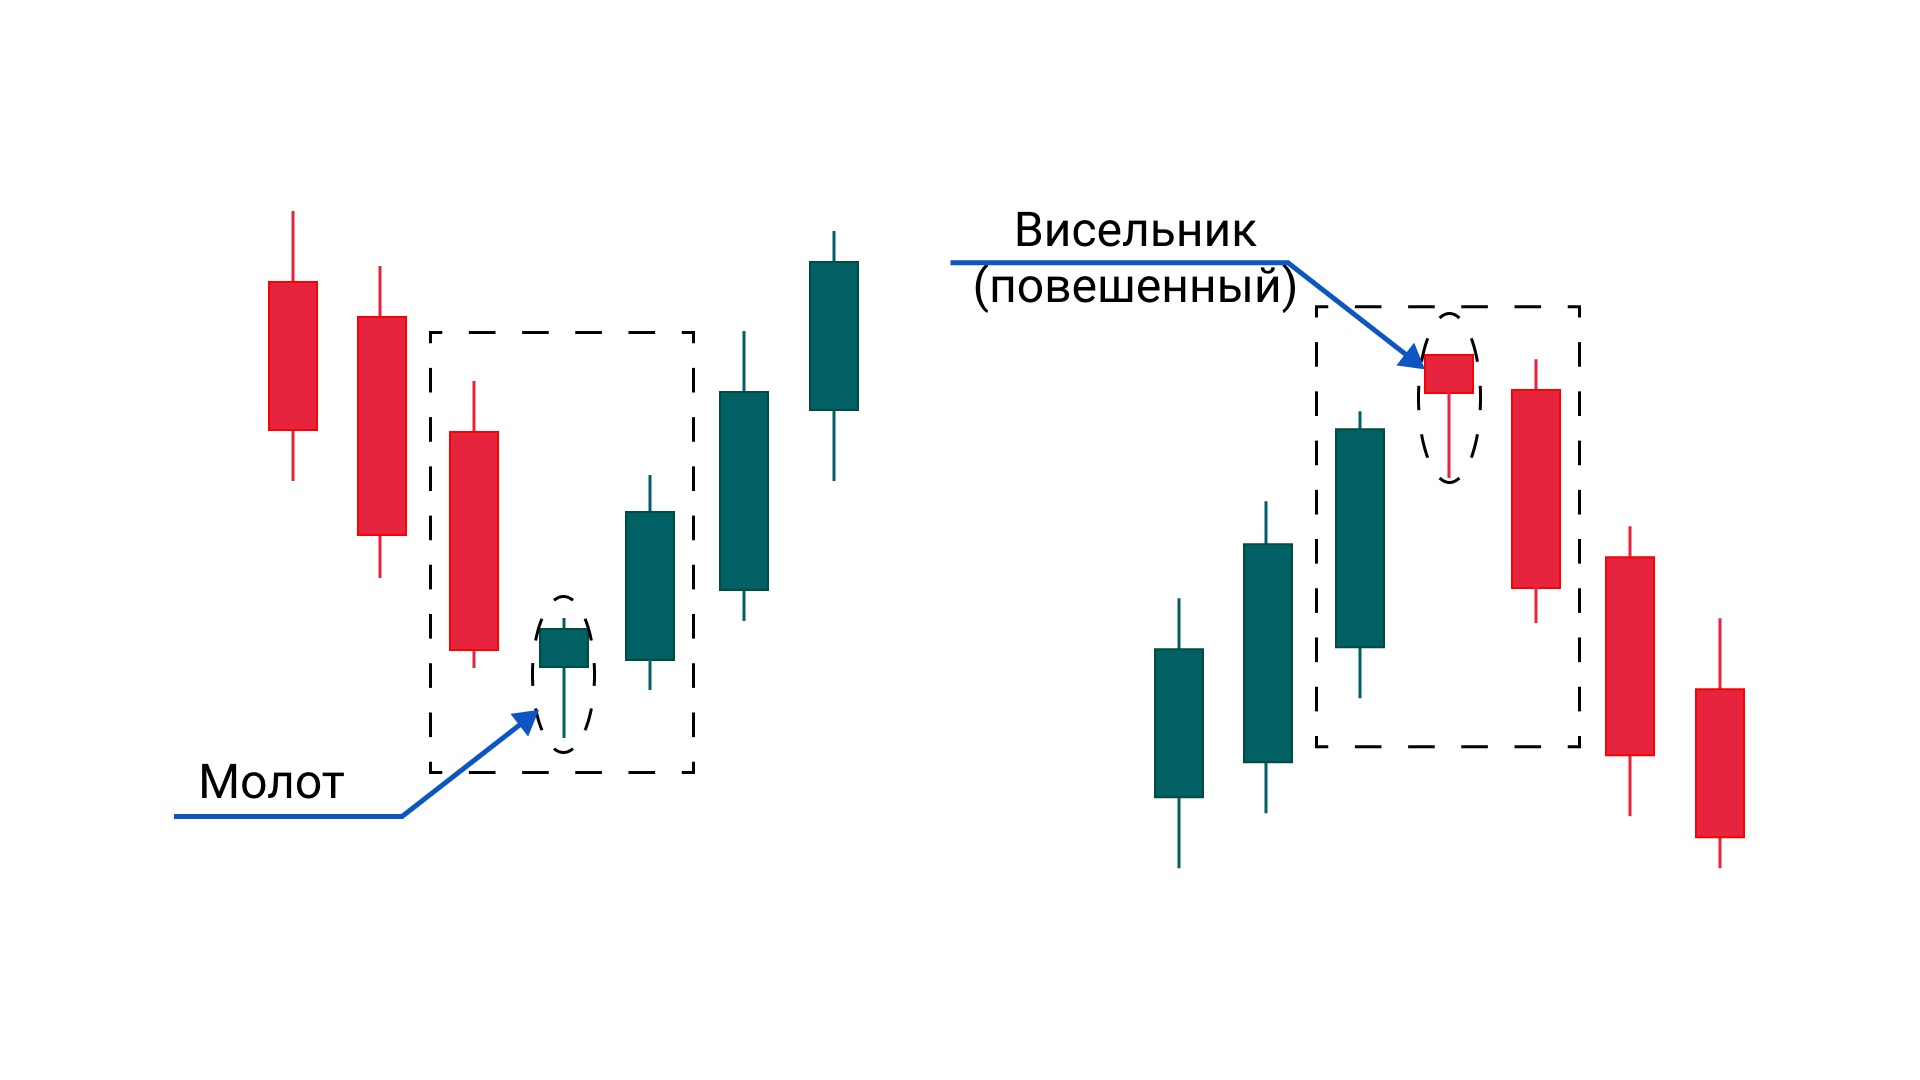
Hammer and Hanging Man
They essentially have very short bodies and long lower shadows.
Hammer is a reversal signal indicating a change from a downtrend to an uptrend. The hammer "bounces" the price off the level and "pushes" it upward.
Hanging Man is a signal indicating a change from an uptrend to a downtrend. In this case, the bulls have "hanged themselves," and fierce, bored bears take over.
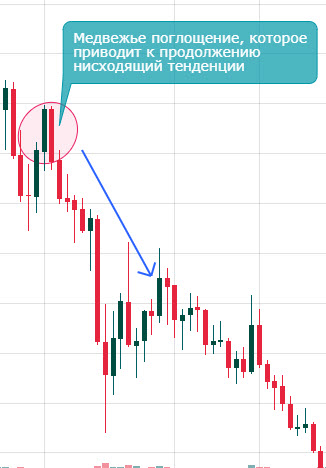
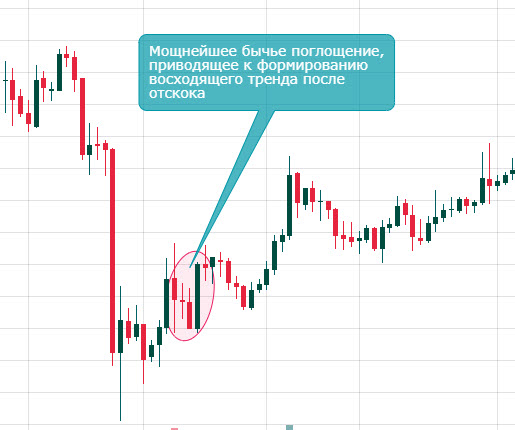
Bearish and Bullish Engulfing
This situation occurs only when sellers dominate the market: an aggressive seller dumps assets at market price, causing panic among other market participants.
In this case, aggressive buyers dominate: the order book is pushed upward, and the price reaches new highs.
Conclusion
This lesson provides all the necessary information about Japanese candlesticks that will help you understand the principles of price formation. Let's repeat some of the stated "postulates":
- Japanese candlesticks provide information about the opening and closing prices of the trading period (determined by the timeframe), as well as its maximum and minimum values.
- The characteristics of Japanese candlesticks clearly reflect the current market condition and the balance of power among its participants.
- A candle turns green (bullish) when the opening price is lower than the closing price.
- A candle turns red (bearish) when the opening price is higher than the closing price.
- There are reversal and continuation candlestick patterns.
- Candles like doji and spinning tops participate in reversal patterns such as "morning/evening star" and "bullish/bearish reversal."
- Marubozu candles indicate a possible trend continuation.
- Bullish or bearish engulfing clearly define the dominant position of either buyers or sellers.
Advertising

Our Contacts
Investment portfolio
-
 mooner.pro Review100 Our deposit
 -
 aitimart.com Review300 Our deposit
Test projects
-
 agronomist-x.com Review300 Our deposit
 -
 taxi-money.info Review3150 Our deposit
Cryptocurrency staking
-
 DELABSPlatform gate
Comments

✅ Получили новую выплату с проекта AitiMart +200$..
✅ Получили новую выплату +200$ ..
Благодарю за приз..
Получил выплату $4.2..
Может быть зимой, однако это учитывая циклы крипты, а это, есть мнения, тоже уже под..
+++ ID операции: 2816423 Дата операции: 04.08.2025 15:00 Сумма: 10.7 USD Примечание:..
Advertising

Information
Users of Гости are not allowed to comment this publication.