

We share verified earning schemes daily on Telegram.
In our Telegram channel, you'll find crypto signals, insider info on HYIPs, combo deals for tappers, and coin giveaways. Only verified earning methods without fluff.
There are six main periods for price charting:
- M (minute): 1M (for 1 minute), 5M (for 5 minutes), 15M (for 15 minutes);
- H (hour): 1H (for 1 hour), 4H (for 4 hours);
- D or D1 (for 1 day);
- W, W1, or Wk (for 1 week);
- MN or Mo (for 1 month);
- Y or T1 (for 1 year).
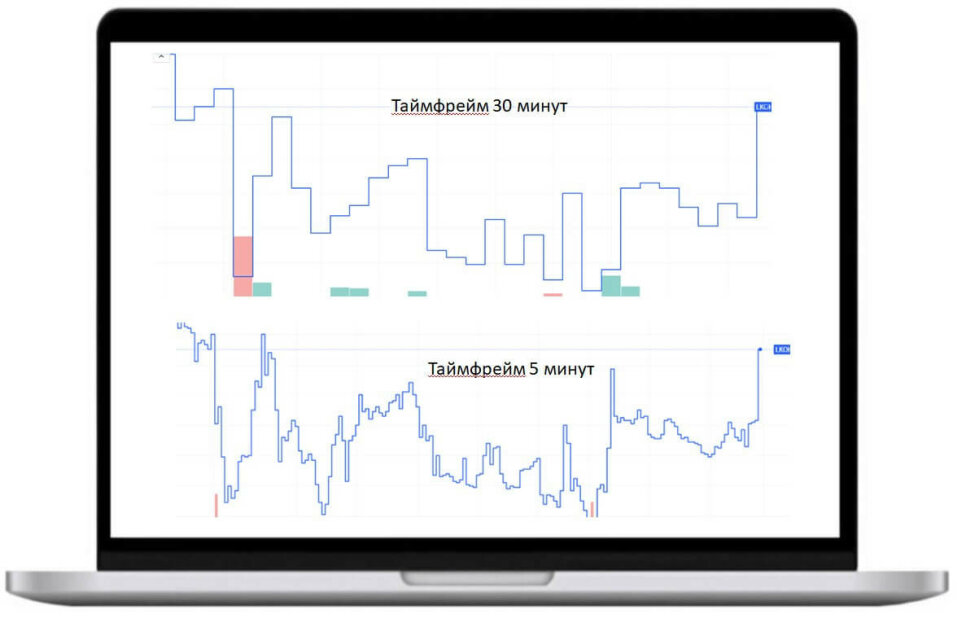
The size of bars and candles depends on the selected timeframe. For example, if the chart is built using the 1H period, each candle or bar will show price dynamics for 1 hour. In the case of Mo, this indicator increases to 1 month (i.e., each candle equals one month), and so on.
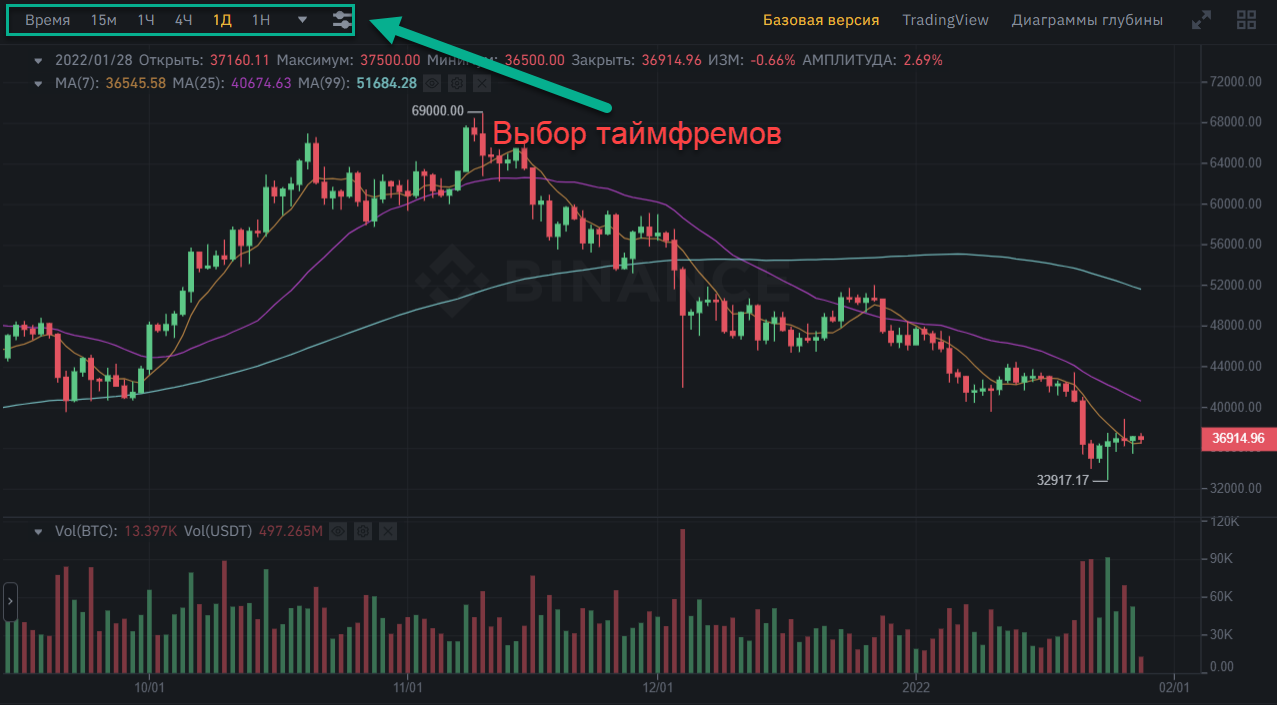
The timeframe selection panel is usually located in the upper-right corner of the exchange terminal or the TradingView window:
Which Timeframes Should You Use?
The timeframe is chosen individually. The choice depends on the trading tactics, the strategy used, and personal preferences. Working with charts of large time periods is relevant when analyzing long-term trends. It allows you to review price changes over an extended period: a month, six months, a year. The results obtained can be used to analyze market development in the long term.
A significant advantage of long-term charts is the absence of false movements. The minimal amount of "noise" helps to more accurately determine key trend lines and resistance levels.
Short-term timeframes are more relevant for scalping. They display current price changes and are best used during significant events, financial news releases, etc. However, it is important to consider that shorter time intervals are less accurate. Determining the future price direction based only on changes over the last day is extremely difficult. You can indeed earn a lot on 5M or 15M timeframes, but due to high noise levels, achieving consistent income will be challenging.
Advertising

Our Contacts
Investment portfolio
-
 mooner.pro Review100 Our deposit
 -
 aitimart.com Review300 Our deposit
Test projects
-
 agronomist-x.com Review300 Our deposit
 -
 taxi-money.info Review3150 Our deposit
Comments

ID операции: 2853416 Дата операции: 17.09.2025 07:37 Сумма: 0.2 USD Примечание: Payment..
Получил Ваш запрос на вывод средств успешно выполнен. Платежная информация Платежная..
+++ ID операции: 2852786 Дата операции: 16.09.2025 11:55 Сумма: 0.6 USD Примечание:..
Выплата! ID операции: 2851745 Дата операции: 16.09.2025 01:05 Сумма: 0.52 USD..
Новая быстрая выплата из топ-проекта:..
Выплата! ID операции: 2851521 Дата операции: 15.09.2025 21:53 Сумма: 6.6 USD..
Advertising

Information
Users of Гости are not allowed to comment this publication.