

We share verified earning schemes daily on Telegram.
In our Telegram channel, you'll find crypto signals, insider info on HYIPs, combo deals for tappers, and coin giveaways. Only verified earning methods without fluff.
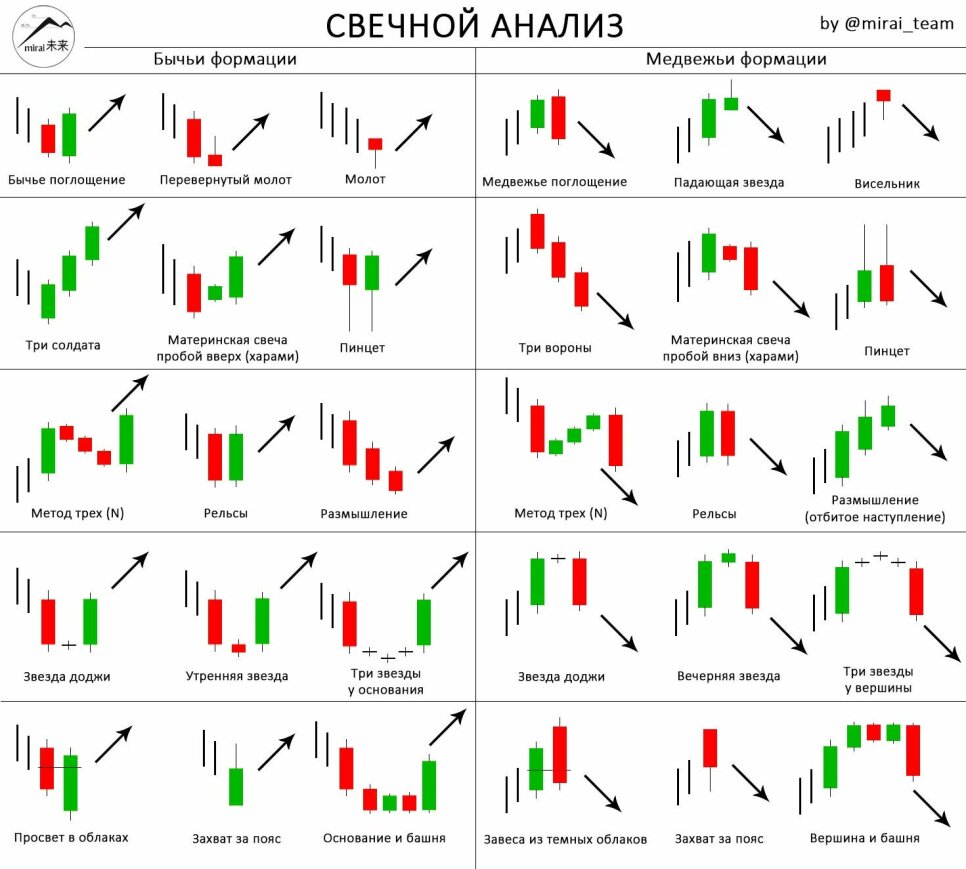
To visualize price movements, lines, bars, and candles can be used – the latter are especially popular. There are several main types of candles, with Japanese candles being used most frequently. They are named after their place of origin: they were invented by rice merchant Homma Munehisa in the mid-18th century.
They became popular due to their simplicity of learning combined with clarity – a single glance at a chart composed of them can provide a lot of information about the market condition. Much more than a glance at a line chart – the reason is that one candle conveys the opening and closing prices, as well as the highs and lows reached during the candle's timeframe; in other words, it provides four significant pieces of information at once.
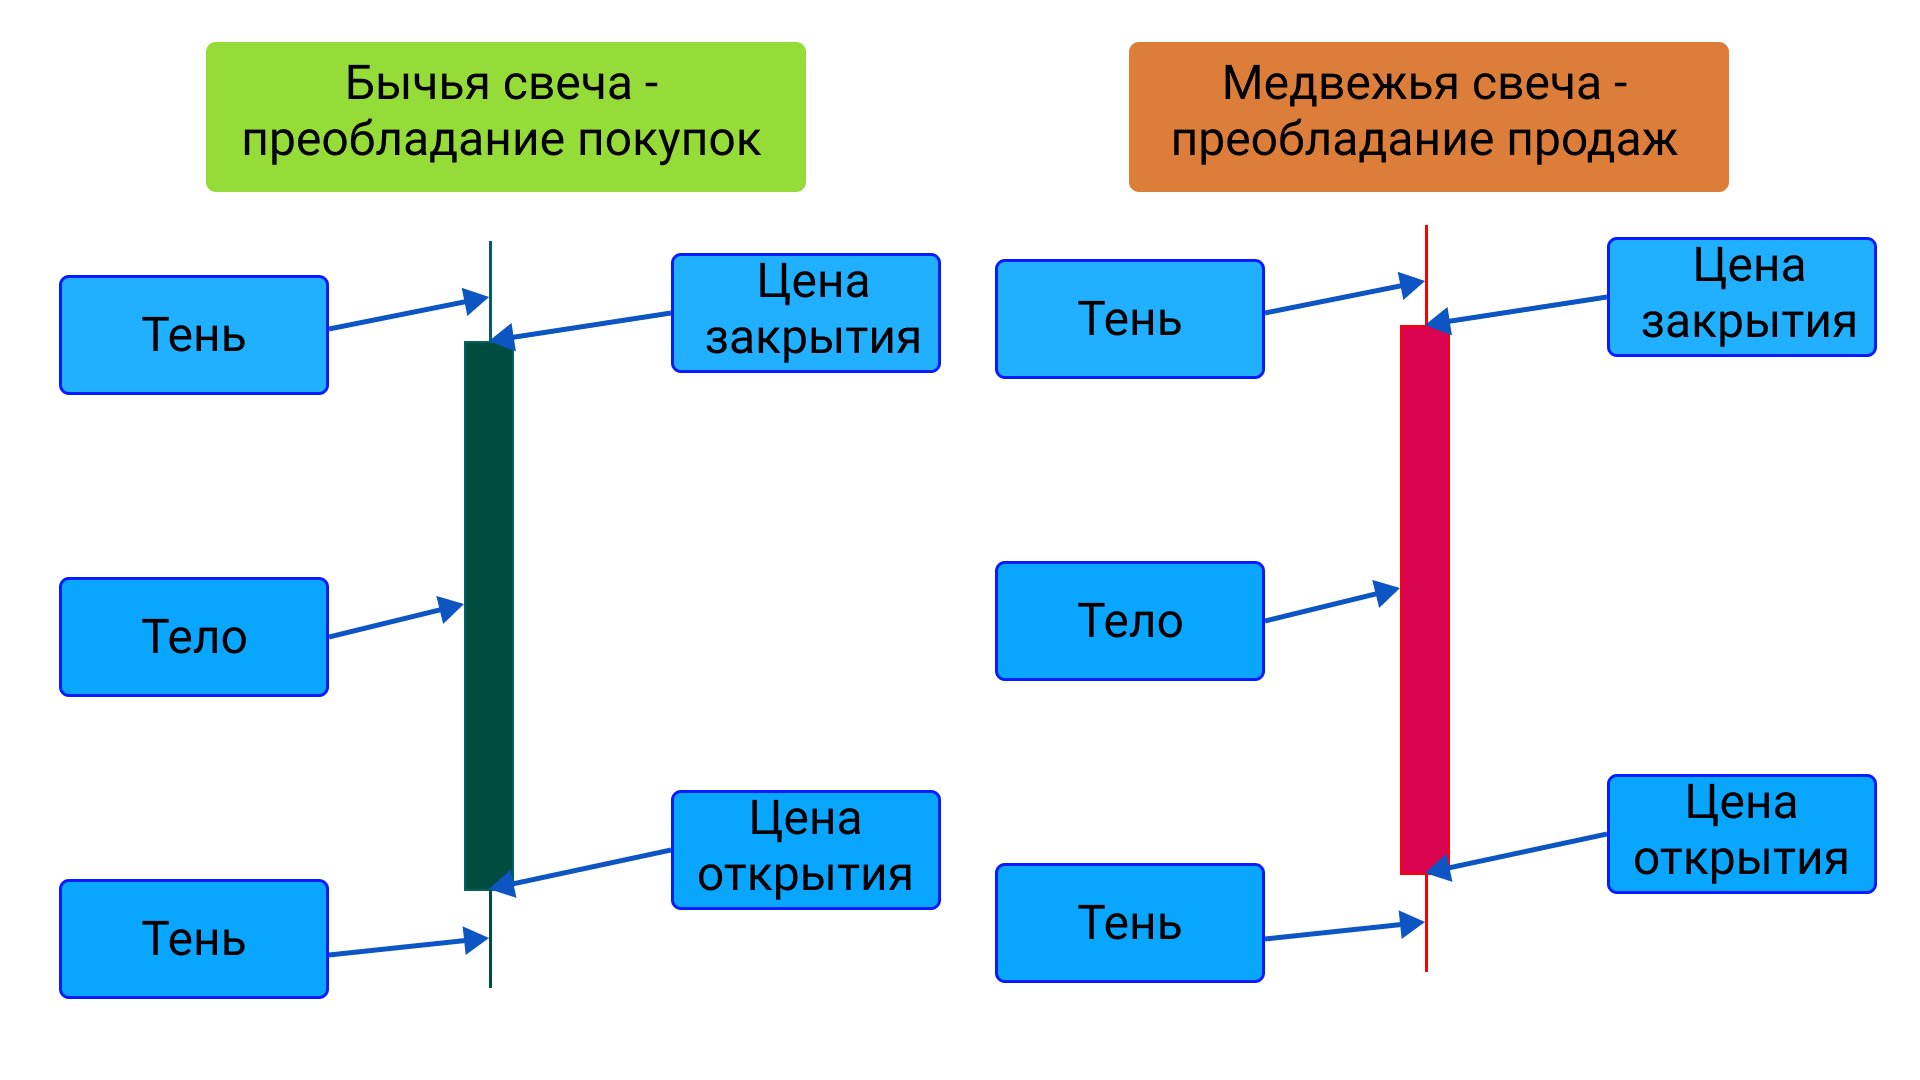
A Japanese candle always has a body, whose boundaries indicate the opening and closing levels. It may also have shadows – these are lines extending from its body upward and downward. They represent the maximum and minimum.
There are two types of candles:
- Bearish. Usually red in color. They indicate that selling predominates.
- Bullish. Usually green in color. Buying predominates.
Even a single candle can tell a story about the battle between buyers and sellers during its timeframe. For example, if it is green with a large body and small shadow – or no shadow at all – then buyers had a clear advantage; if it is small with a large upper shadow, it means the battle was fierce but managed to push the price slightly upward.
You can read more about analyzing Japanese candles in 👉 this lesson from our free Crypto[START] training course.
Advertising

Our Contacts
Investment portfolio
-
 mooner.pro Review100 Our deposit
 -
 aitimart.com Review300 Our deposit
Test projects
-
 agronomist-x.com Review300 Our deposit
 -
 taxi-money.info Review3150 Our deposit
Comments

ID операции: 2850698 Дата операции: 15.09.2025 07:57 Сумма: 0.2 USD Примечание: Payment..
Уважаемый New User! На ваш баланс зачислены средства. ID операции: 2850817 Дата операции:..
Очередная быстрая выплата из топ-проекта: 15.09.2025, 06:34 Hello, Igor Drobnitsa! Your..
Новый депозит $200. Админ снова понизил максимальный лимит...

✅ Получили новую выплату с проекта AitiMart +250$..
✅ Получили новую выплату +250$ ..
Advertising

Information
Users of Гости are not allowed to comment this publication.