

We share verified earning schemes daily on Telegram.
In our Telegram channel, you'll find crypto signals, insider info on HYIPs, combo deals for tappers, and coin giveaways. Only verified earning methods without fluff.
RSI, or the Relative Strength Index indicator, is one of the most fundamental tools in technical analysis. Its essence lies in its ability to predict future activity based on a collection of data about previous trends. The indicator helps forecast market structure and potential price fluctuations in the future over specific time intervals.
By nature, the indicator is an oscillator, which, simply put, is a metric that oscillates. The oscillator tracks price movements and the speed of these movements. In simple terms, RSI indicates whether the price of a selected cryptocurrency is in a strong or weak state. This indication is based on closing prices over a specific period, positively influencing the efficiency of analysis.
Main Metrics and Criteria for Using RSI:
- RSI value close to zero — downward price movement slows;
- RSI value close to one hundred — upward price movement weakens more actively;
- RSI>70 — overbought condition of the asset;
- RSI<30 — oversold condition;
- RSI=50 — midpoint or absence of trend.
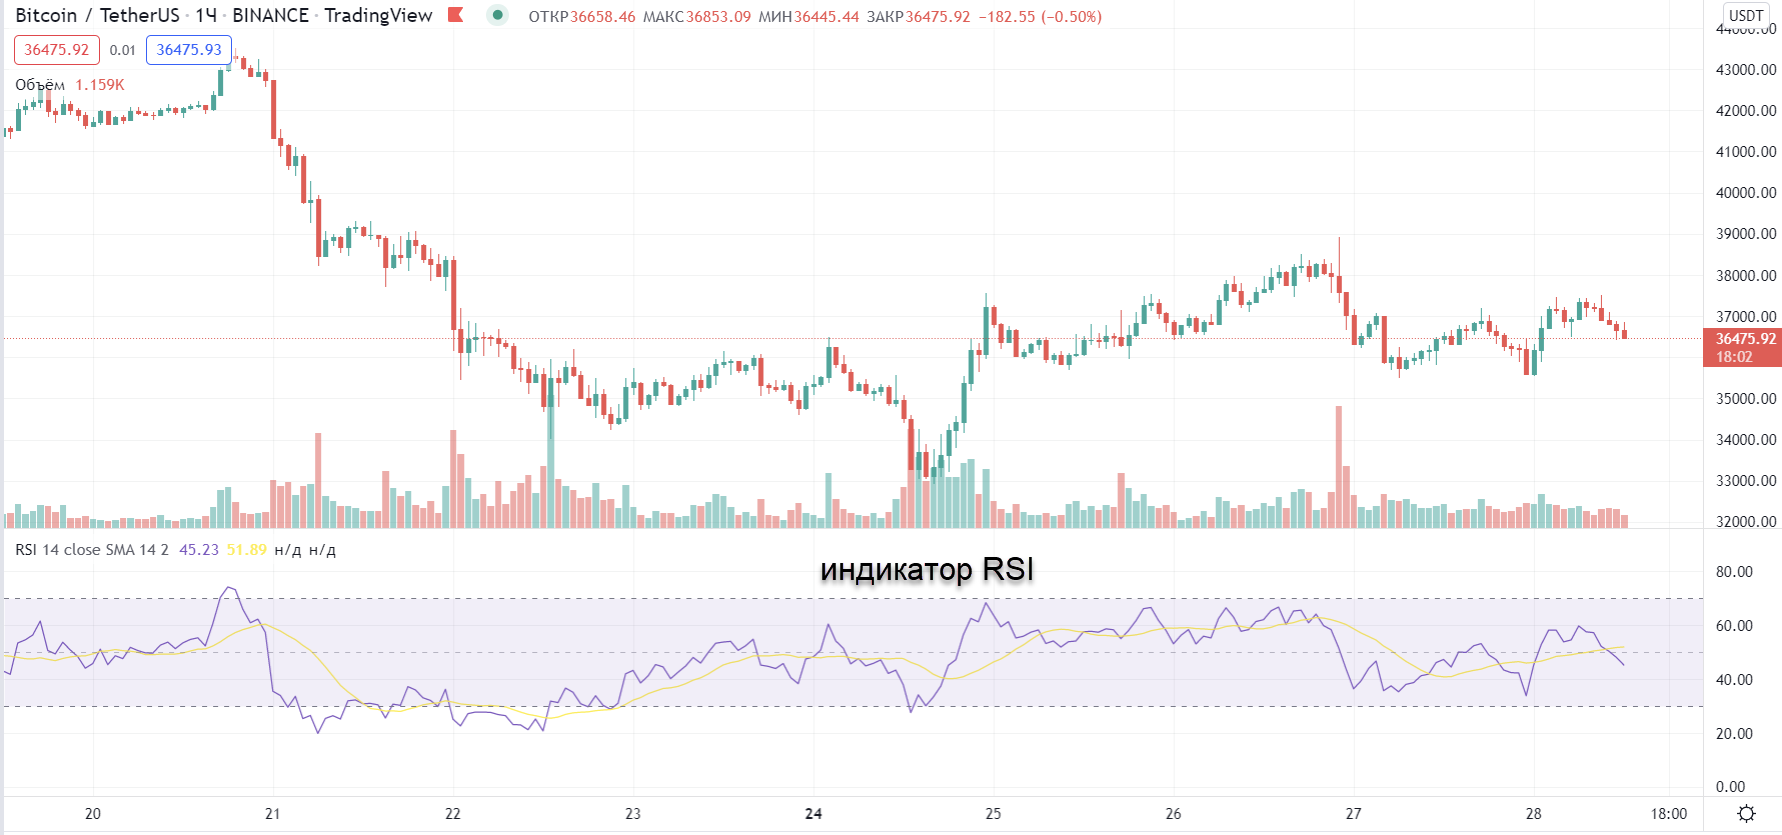
Additionally, the oscillator allows understanding the trend reversal in price movement. If the price rises while RSI decreases — bearish divergence. If the price declines while the oscillator increases — bullish divergence.
You can read more about trading using RSI in 👉this lesson from the free Crypto[START] course.
Advertising

Our Contacts
Investment portfolio
-
 mooner.pro Review100 Our deposit
 -
 aitimart.com Review300 Our deposit
Test projects
-
 agronomist-x.com Review300 Our deposit
 -
 taxi-money.info Review3150 Our deposit
Comments

Реинвест с баланса на 29$..
Выплата! ID операции: 2833722 Дата операции: 28.08.2025 14:03 Сумма: 25.5 USD..
На ваш баланс зачислены средства. ID операции: 2833953 Дата операции: 28.08.2025 19:14..
Уважаемый New User! На ваш баланс зачислены средства. ID операции: 2833951 Дата операции:..
Получена новая выплата. Ваш депозит успешно подтвержден. Сумма депозита:4 USDT Вид..

✅ PAYING Aitimart Transactions details: 0.04177917 LTC Transaction id:..
Advertising

Information
Users of Гости are not allowed to comment this publication.