We share verified earning schemes daily on Telegram.
In our Telegram channel, you'll find crypto signals, insider info on HYIPs, combo deals for tappers, and coin giveaways. Only verified earning methods without fluff.
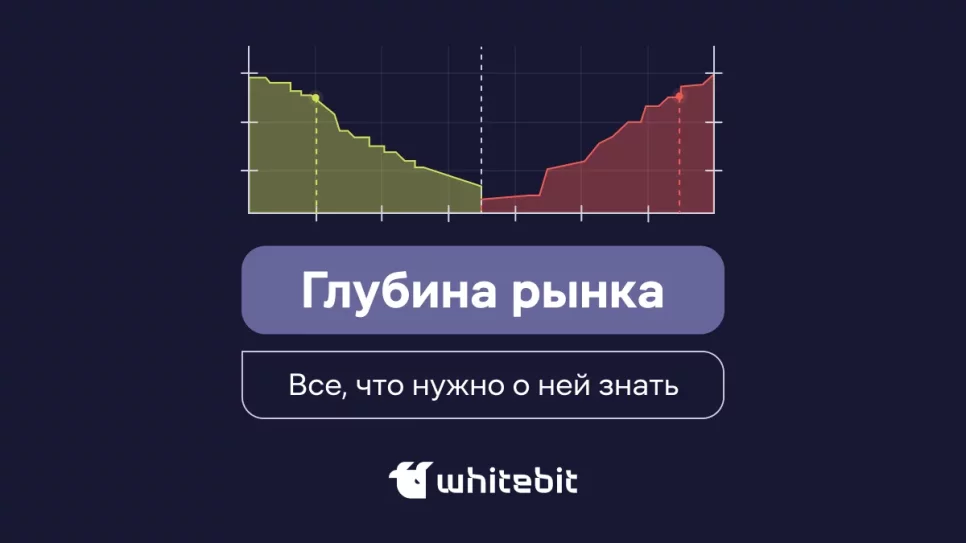
Cryptocurrencies, like any other exchange-traded assets, are traded by traders based on technical analysis. It is analysis that allows for making thoughtful and profitable trades without losing initial investments. The depth chart is present on any exchange and is also part of technical analysis. Its main features will be discussed below.
What is a depth chart or diagram in trading?
The depth indicator reflects the number of pending orders when trading a specific asset. If it is said that the market depth is low - this means that a small number of pending orders have been created. Great depth provides information about a huge number of orders, which allows for large trades to be conducted unnoticed by the market, with the cryptocurrency rate not changing significantly.
Such a chart is usually contained in the order book, also called the market depth. If 60-70 percent of orders are directed towards buying - then the cryptocurrency has strong positions and has an upward trend. Conversely, if more than 50 percent of orders are directed towards selling, then the asset has a downward movement and the price is falling. You don't have to be a major player; the direction of the majority of orders will easily suggest to a beginner which direction to move in.

Features of the chart
Such a diagram provides only approximate data and should be used in conjunction with other technical analysis tools. The chart cannot reflect all active orders, as it has a visual and generalized nature.


Information
Users of Гости are not allowed to comment this publication.